Management Discussion and Analysis
Financial Review 2022
This financial review provides details of the Bank’s financial performance of the year under review. It is meant to be read in conjunction with the Operating Context and Outlook, which explains the broader global, local, and sector trends that contextualise the Bank’s performance, and the Management Discussion and Analysis, which analyses how the Bank grew its financial and other capitals in relation to its Sustainability Framework and the strategic imperatives.
Performance of the Group
An overview
In a period of unprecedented macroeconomic variables, the Commercial Bank Group comprising of Sri Lanka’s largest private sector bank, its subsidiaries and the associate, ended the year 2022 with a solid operational performance, having navigated the perfect storm with a series of forward-looking strategies. The Group saw its assets growing by Rs. 516.063 Bn., or 26.02% (2021 – 12.54%) to approach the Rs. 2.5 Tn., at end of 2022. The gross income of the Group recorded a growth of 71.31% (2021 – 7.70%) to reach Rs. 280.387 Bn., compared to Rs. 163.675 Bn. recorded in 2021, while total operating income and profit after tax of the Group for the year reached Rs. 136.637 Bn., (2021 – Rs. 93.598 Bn.) and Rs. 24.399 Bn., (2021 – Rs. 24.290 Bn.) respectively.
Given that the Bank accounted for 97.05% of the total assets (2021 – 98.27%) and 94.14% of the profit of the Group (2021 – 97.18%), the analysis below provides a detailed account of the Bank’s financial performance, followed by a brief commentary on the performance of the Bank’s operations in Bangladesh, other overseas operations, local subsidiaries and the associate as given in this section.
Performance of the Bank
An overview
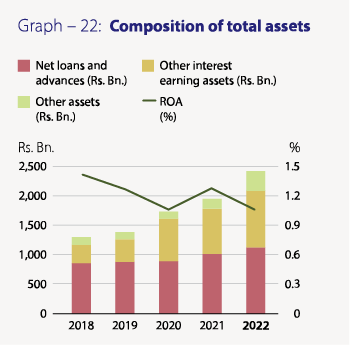
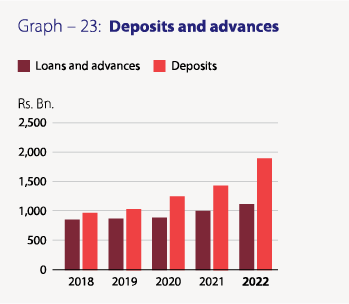
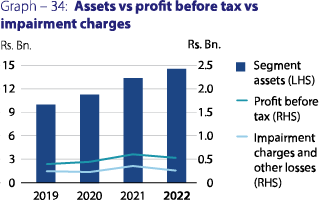
Total assets of the Bank grew by Rs. 476.585 Bn., or 24.45% (2021 – 12.27%) during the year under review and stood at Rs. 2.426 Tn., as at December 31, 2022 (2021 – 1.949 Tn.). The growth in assets was almost fully funded by the growth in deposits of Rs. 471.266 Bn., or 32.66% (2021 – 13.99%), which reached Rs. 1.914 Tn., as at the year-end (2021 – Rs. 1.443 Tn.). Lending portfolio net of provision for impairment grew by Rs. 115.824 Bn., or 11.42% (2021 – 13.13%) during the year and stood at Rs. 1.130 Tn., at the year end (2021 – Rs. 1.015 Tn.).
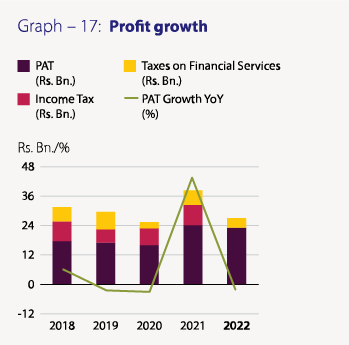
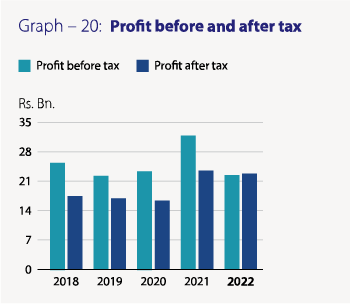
The profit after tax of the Bank for the year 2022 amounted to Rs. 22.970 Bn., compared to Rs. 23.606 Bn., reported in 2021 and recorded a marginal decrease of 2.70%. (2021 – growth of 44.17%). This can be considered extremely satisfactory given the unprecedented macroeconomic volatilities that prevailed throughout the year under review during which the Bank had to make the impairment charges in a single year in its history. Total operating income for the year recorded a significant increase of 45.40% and stood at Rs. 132.888 Bn., compared to Rs. 91.395 Bn. reported in 2021 (2021 – 21.96%). This helped the Bank to mitigate the impact of the impairment charges and other losses made in 2022 of Rs. 71.462 Bn., compared to Rs. 24.692 Bn., made in 2021 which reflected a record increase of 189.41% (2021 – 14.94%) facilitating the Bank to report an operating profit before taxes of Rs. 26.491 Bn., for 2022 compared to Rs. 37.810 Bn., recorded in 2021 which reflected a negative growth of 29.94% (2021 – growth of 34.96%).
The lacklustre performance witnessed in both the ASPI and S&P SL20 indices of the Colombo Stock Exchange (CSE) during the year 2022 further hampered volumes of shares traded and the share prices of the banking sector due to the perceived elevated risks associated with the banking sector arising from the unprecedented operating environment. However, the price to book value and the market capitalisation of the Bank’s shares remained the highest among peers in the Banking sector. The Bank’s market capitalisation ranked twelfth among all listed companies on the Colombo Stock Exchange as at December 31, 2022.
With due consideration to the performance of the Bank during the year, the dividend policy and the Bank’s commitment to pay a reasonable dividend to the shareholders, the Board of Directors has recommended a first and final scrip dividend of Rs. 4.50 per share for the year 2022 (2021: Rs. 7.50 per share, which comprised of a cash dividend of Rs. 4.50 per share and a scrip dividend of Rs. 3.00 per share).
Income Statement
Financial intermediation
Gross income grew by 71.20% (2021 – 7.46%) to Rs. 275.444 Bn., for the year from Rs. 160.886 Bn., reported in 2021, primarily due to the noteworthy contributions made by the three main sources of gross income, being income from fund-based operations, income from fee-based operations and income from other sources as explained in the following section. As the growth in gross income for the year is higher than the growth in average assets for the year of 18.71% (2021 – 17.99%), the financial intermediation margin (gross income/average total assets) improved to 12.59% as at end of 2022 (2021 – 8.73%), with an appreciable improvement of 386 bps. The financial intermediation margin for the banking sector for the year was 12.03% (2021 – 8.53%).
Fund-based operations
Interest income, which accounted for 79.26% (2021 – 81.08%) of the gross income of Rs. 275.444 Bn., increased to Rs. 218.327 Bn., during the year from Rs. 130.443 Bn., in 2021, recording a significant improvement of 67.37% (2021 – 6.63%). This was mainly attributable to the growth in both the average interest-earning assets by Rs. 238.630 Bn., and the increase in average rate of interest on interest earning assets by 3.59%. Firstly, the average interest-earning assets grew due to the sharp depreciation of the Sri Lankan Rupee against the US Dollar from Rs. 200 to Rs. 367 during the year, boosting the Rupee equivalent of the foreign currency denominated assets. Secondly, the average rate of interest on interest earning assets improved due to the increase in income from foreign currency denominated assets due to the depreciation of Sri Lankan Rupee as explained above and the sharp increase in market interest rates consequent to the significant increase in policy rates by the CBSL in early part of 2022. Consequently, the excess liquidity that arose from the growth in deposits over the growth in loans and advances, was invested in government securities during the year 2022. As a result, interest income earned from sources other than loans and advances, accounted for 34.46% (2021 – 39.38%) of total interest income, an increase of 46.47% compared to 2021 (2021 – 40.54%). In the meantime, interest income from loans and advances increased by 80.95% in 2022 (2021 – negative growth of 7.82%) owing to the sharp increase in market interest rates that prevailed during the most part of the year and also due to the impact of depreciation of the Sri Lankan Rupee.
Interest expenses, which accounted for 62.56% of the interest income (2021 – 50.47%), more than doubled to Rs. 136.583 Bn., during the year from Rs. 65.832 Bn., reported in 2021, recording a mammoth growth of 107.47% (2021 – negative growth of 9.52%). This was mainly due to growth in average interest-bearing liabilities by Rs. 259.741Bn., and also due to the sharp increase in the average cost of funds by 2.95% consequent to the repricing of liabilities in keeping with the market interest rates which eventually resulted in a shift of funds from low-cost to high-cost funds. The increase in interest payments on deposits and borrowed funds denominated in foreign currency consequent to the depreciation of Sri Lankan Rupee too contributed for the increase in cost of funds. Although the CASA ratio of the Bank, which is considered as the industry benchmark reduced to 38.36% from 47.83% as at end 2021 stood very much above the industry average of 33.13%.
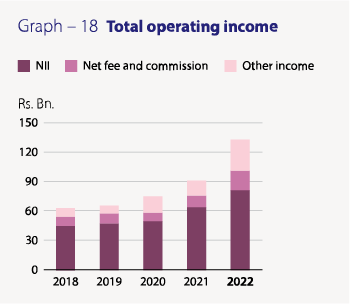
Consequently, net interest income of the Bank improved to Rs. 81.744 Bn., from Rs. 64.611 Bn., reported in 2021, recording a notable growth of 26.52% (2021 – 30.34%), accounting for 61.51% of the total operating income (2021 – 70.69%) and as a result the net interest margin of the Bank improving by 23bps to 3.74% in 2022 compared to 3.51% reported in 2021.
Fee-based operations
Fee and commission income amounted to Rs. 25.464 Bn., compared to Rs. 15.410 Bn. reported in 2021, recording a growth of 65.24% (2021 – 36.76%) mainly due to an increase in income from trade and remittance businesses and credit and debit cards related services during the year.
Fee and commission expenses, which relate mostly to credit and debit cards related services increased to Rs. 5.973 Bn., from Rs. 3.659 Bn., reported in 2021, recording an increase of 63.24% (2021 – 81.84%). The sharp depreciation of the Rupee against the US Dollar during 2022 too contributed for increases in both the commission income received in foreign currency and the fees paid in foreign currency mostly related to cards increased sharply due to the same reason. Consequently, net fee and commission income increased to Rs. 19.491 Bn., compared to Rs. 11.751 Bn., reported in 2021, recording a growth of 65.86% (2021 – 26.95%), and it accounted for 14.67% of the total operating income (2021 –12.86%).
Other income
Total other income of the Bank, comprising of net gains or losses from trading, net gains or losses from derecognition of financial assets and net other operating income more than doubled by 110.57% to Rs. 31.653 Bn., for the year compared to Rs. 15.032 Bn. reported in 2021 (2021 – negative growth of 6.70%). The main contributory factor for this increase was the substantial exchange gains earned by the Bank due to the sharp depreciation of the Sri Lankan Rupee against the US Dollar during 2022 and the gains recorded from swaps/forward transactions done.
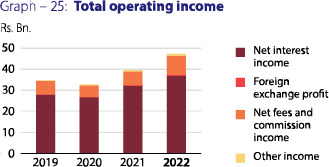
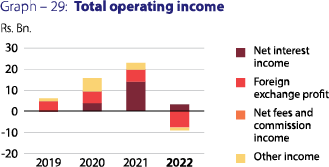
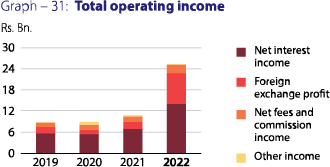
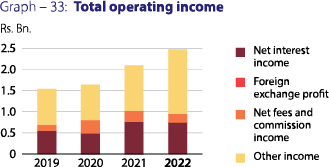
Total operating income
Consequent to the notable improvements in net interest income, net fee and commission income, and in other income, total operating income of the Bank grew to Rs. 132.888 Bn., by Rs. 41.494 Bn., or 45.40% compared to Rs. 91.395 Bn., reported in 2021 (2021 – 21.96%).
Impairment charges
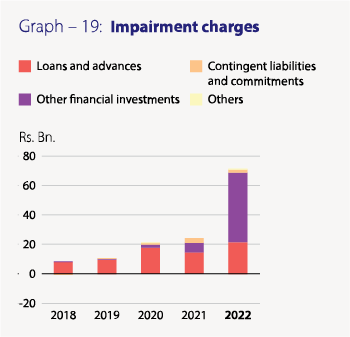
Impairment charges and other losses for the year increased to Rs. 71.462 Bn., by 189.41% (2021 – 14.94%) from Rs. 24.692 Bn. reported in 2021, recording the highest provision the Bank has ever made for a single year in its history. This was mainly due to the Bank providing Rs. 47.134 Bn. (2021 – Rs. 6.893 Bn.) on account of foreign currency denominated securities issued by the Government of Sri Lanka consequent to the downgrading of the sovereign rating and Rs. 24.150 Bn., for loans and advances portfolio (2021 – Rs. 17.791 Bn.) under individual and collective impairment provisions and by way of management overlays to account for potential losses which the impairment models may not be capturing due to the high level of uncertainty and volatility that prevailed throughout the year.
Net operating income
The robust growth in total operating income by Rs. 41.494 Bn., was not adequate to off-set the unprecedented increase in impairment charges and other losses of Rs. 71.462 Bn., resulting in the net operating income reducing by Rs. 5.275 Bn., or 7.91% to Rs. 61.427 Bn., for the year (2021 – a growth of 24.78%) compared to Rs. 66.702 Bn., reported in 2021.
Operating expenses
Total operating expenses for the year amounted to Rs. 34.936 Bn., compared to Rs. 28.892 Bn. reported in 2021 and recorded an increase of Rs. 6.044 Bn., or 20.92% (2021 – 13.57%). This was mainly as a result of the increase in personnel expenses by 17.10% (2021 – 12.07%) to Rs. 19.113 Bn., from Rs. 16.321 Bn., for 2021, due to the salary increases granted and increases in other staff related expenses. In addition, other operating expenses for the year too increased by 30.54% (2021 – 19.08%) to Rs. 12.260 Bn., from Rs. 9.392 Bn., for 2021, due to price hikes in relation to almost all expense categories, increase in foreign currency related payments for the maintenance of assets consequent to the sharp depreciation of the Sri Lankan Rupee against the US Dollar and an increase in the VAT rate twice during the year from 8% to 15%.
However, consequent to the efforts taken to contain the operating expenses despite the inflationary pressures, the Bank’s Cost to Income ratio (excluding taxes on financial services) for the year 2022 improved to 26.29% from 31.61% in 2021.
Profit before and after taxes
The increase in impairment charges and other losses by 189.41% and the increase in total operating expenses by 20.92% resulted in operating profit before taxes on financial services reducing to Rs. 26.490 Bn., compared to Rs. 37.810 Bn., recorded in 2021 by Rs. 11.320 Bn., or 29.94% (2021 – growth of 34.96%).
In line with the decrease in operating profit, the taxes on financial services for the year reduced to Rs. 3.892 Bn., compared to Rs. 5.809 Bn., for 2021 and recorded a decrease of Rs. 1.917 Bn., or 33.00% (2021 – an increase of 28.94%). Consequently, the Bank’s Cost to Income ratio (including taxes on financial services) for the year 2022 improved to 29.22% from 37.97% in 2021.
The profit before income tax expense for the year decreased to Rs. 22.598 Bn., compared to Rs. 32.001 Bn., reported in 2021 and recorded a reduction of Rs. 9.403 Bn., or 29.38% (2021 – an increase of 36.11%). Income tax charge for the year reflected a reversal of Rs. 0.371 Bn., compared to a tax charge of Rs. 8.395 Bn., for 2021, and this reflected a decrease of Rs. 8.767 Bn., 104.42% in YoY tax charge (2021 – an increase of 17.62%). The reversal in income tax charge was primarily due to an increase in the deferred tax assets consequent to the change in the income tax rate to 30% effective from July 01, 2022, from the previous income tax rate of 24% where the effect of the overall reversal in deferred tax was more than the current tax liability which was computed at two different income tax rates, the first being at 24% on the taxable income for the first half of the year and second being at 30% on the taxable income of the second half for the Sri Lankan Operation of the Bank. The tax provision for the Bank’s Bangladesh Operation has been computed at 40% for the full year.
Consequently, the profit after tax for the year recorded a negative growth of 2.70% (2021 – a positive growth 44.17%) and stood at Rs. 22.970 Bn., compared to Rs. 23.606 Bn. reported for 2021.
Profitability
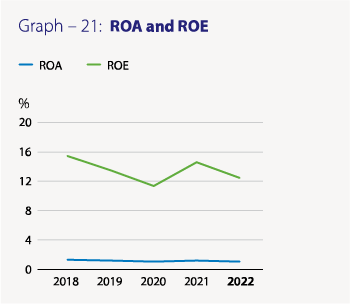
Reflecting the negative growth in profit after tax and the higher growth in total assets and equity during the year, both Return on Assets (ROA) and Return on Equity (ROE) reduced to 1.05% (2021 – 1.28%) and 12.46% (2021 – 14.66%) respectively. ROA (before tax) for the year too reduced to 1.03% (2021 – 1.74%).
Other Comprehensive Income (OCI)
Other comprehensive income of the Bank reported an income of Rs. 26.215 Bn., during the year as against an expense of Rs. 10.705 Bn., reported for 2021, primarily due to a net reversal in the fair value losses o/a reclassification of debt instruments from Fair Value Through Other Comprehensive Income (FVOCI) to Amortised Cost (AC), amounting to Rs. 12.292 Bn., (2021 – Nil). The Bank reclassified bulk of its Treasury Bond Portfolio amounting to Rs. 197.08 Bn., majority of the Sri Lanka Development Bond (SLDB) portfolio amounting to Rs. 55.85 Bn., (USD 152.19 Mn.) and entire Sri Lanka Sovereign Bond (SLSB) portfolio amounting to Rs. 39.87 Bn., (USD 108.63 Mn.) from FVOCI category to AC category, with effect from April 01, 2022, in line with the guidelines issued by the CA Sri Lanka in the form of a Statement of Alternative Treatment (SoAT) on “Reclassification of Debt Portfolio due to unprecedented changes in the macro-economic conditions”. The above mentioned Rs. 12.292 Bn., consists of the cumulative losses that the Bank recognised (net of tax) in the equity through OCI prior to the aforesaid reclassification. The loss reported in the OCI of the Bank during the year 2021 was primarily due to net losses that arose on investments in financial assets at FVOCI, amounting to Rs. 12.599 Bn. In addition, there was a gain of Rs. 14.877 Bn. (2021 – Rs. 1.153 Bn.) on translation of financial statements of foreign operation of the Bank.
Accordingly, the total comprehensive income of the Bank for the year 2022 increased to Rs. 49.185 Bn., compared to Rs. 12.901 Bn., reported in 2021, reflecting a growth of 281.24% (2021 – a negative growth of 27.44%).
Statement of Financial Position
The Bank is the first private sector bank in the country to cross the Rs. 1 Tn. in total assets (in 2016), deposits (in 2019) and loans and advances (in 2021).
Assets
Total assets of the Bank grew by a noteworthy 24.45% (2021 – 12.27%) during the year to reach Rs. 2.426 Tn., from Rs. 1.949 Tn., at the end of the previous year. This growth is well in excess of the industry growth of 14.12% (2021 – 12.46%). This was largely due to the upward revaluation effect of the assets and liabilities of the Bank which are denominated in foreign currency due to the sharp depreciation of the Rupee against the US dollar during the first half of the year and also due to the increase in investments in Government Securities due to the excess liquidity created consequent to the growth in deposits being higher than the growth in loans and advances.
Loans and advances to customers
Reversing the trend observed in the first half of 2022, credit to the private sector increased during the latter part of the year despite the adverse macro-economic environment that prevailed in the country. The gross loans and advances portfolio as at December 31, 2022 stood at Rs. 1.220 Tn., compared to Rs. 1.079 Tn., a year ago and the net loans and advances as at December 31, 2022 stood at Rs. 1.130 Tn., compared to Rs. 1.015 Tn., as at end 2021, recording a growth of 11.42% (2021 – 13.13%), and it accounted for 46.60% (2021 – 52.05%) of total assets as at December 31, 2022.
The Bank continued to extend concessions and accommodate moratorium requests of the borrowers affected by both the Easter Sunday attack and the COVID-19 pandemic during the year 2022 as well. The loans and advances portfolio under active moratoria increased from Rs. 50.877 Bn., as at December 31, 2021 to Rs. 86.294 Bn., by end 2022 despite certain sectors coming out of the forbearance measures. We continued to engage with these customers and accommodated reschedulements/alternative action plans to help them.
Asset quality
Quality of the loans and advances portfolio is a key determinant of the sustainability of the Bank’s operations. The conservative risk profile, with a moderate risk appetite and a robust risk management framework, helped the Bank to end the year with both the Net Impaired Loans (Stage 3) to Total Loans and Advances Ratio and Impaired Loans (Stage 3) to Total Loans and Advances Ratio (excluding undrawn commitment) at 5.25% (2021 – 4.08%) and 9.41% (2021 – 7.33%), respectively, compared to industry averages of 10.82% and 10.94%, respectively. Despite there being a deterioration in both the above ratios in 2022 in view of the unprecedented macro-economic conditions prevailing in the country, both the above ratios can be considered acceptable compared to the industry averages.
In addition, both the impairment (Stage 3) to Stage 3 Loans Ratio (Stage 3 Impairment Coverage Ratio) and the cumulative impairment provisions for loans and advances as a percentage of the total loans and advances portfolio (Total Impairment Coverage Ratio) stood at 40.42% (2021 – 44.34%) and 7.32% (2021 – 5.94%) respectively, by end of 2022, compared to industry averages of 43.59% and 7.26%, respectively. The Bank continued to re-evaluate the stage assessment criteria for loans and advances to reflect the actual risks associated with customers.
The open credit exposure ratio (which is the net exposure on Stage 3 loans as a percentage of regulatory capital) stood at 34.41% at end of 2022 (2021 – 25.33%).
The loans to customers portfolio of the Bank is fairly well diversified across a wide range of industry sectors with no significant exposure to any particular sector. Please see note 33 for the details.
Deposits
With the solid domestic franchise in Sri Lanka, customer deposits continued to be the single biggest source of funding for the Bank, accounting for 78.92% (2021 – 74.03%) of the total assets as at December 31, 2022. Deposits grew by 32.66% (2021 – 13.99%) to Rs. 1.914 Tn. as at December 31, 2022, partly due to the effect of the depreciation of the Rupee against the US Dollar. The growth in deposits during the year was Rs. 471.266 Bn., while the CASA ratio reduced to 38.36% (2021 – 47.83%) as at December 31, 2022, which is still considered as the best ratio compared to industry average of 33.13%.
Other liabilities
The significant increase in deposit liabilities when compared to the lower growth in loans and advances meant that the Bank had excess liquidity during most part of the year. This helped the Bank to reduce its external borrowings during the year enabling it to reduce its interest expenses and improve its net interest income and the interest margins as explained earlier. The total other liabilities as at the year-end reduced to Rs. 307.740 Bn., from Rs. 341.226 Bn., at end of 2021. During the year, the Bank raised Rs. 10.000 Bn. through an issue of BASEL III compliant debentures while there were no debentures that matured during the year.
Capital
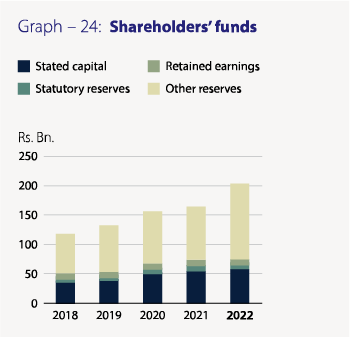
The Bank is guided by its ICAAP, Capital Augmentation Plan and the Board approved dividend policy in maintaining capital commensurate with its current and projected business volumes. Accordingly, with the profit for the year, other comprehensive income for the year and the prudent dividend policy helped the Bank to grow its equity capital by a solid 23.53% (2021 – 4.93%) to Rs. 203.699 Bn., as at December 31, 2022 from Rs. 164.894 Bn., as at December 31, 2021. With an on-balance sheet multiplier (gearing ratio) of 11.91 times (2021 – 11.82 times), equity funded 8.40% (2021 – 8.46%) of the total assets as at the current year end, compared to the industry average of 12.78 times. The Bank ploughed back Rs. 18.353 Bn., out of profit for the year in 2021 after the payment of cash dividends.
The risk weighted assets of the Bank grew by 22.10% (2021 – 8.95%) to Rs. 1.355 Tn., as at December 31, 2022, from Rs. 1.110 Tn., as at end of 2021. Consequently, both the Tier 1 and the total capital ratios stood at 11.389% (2021 – 11.923%) (minimum requirement – 10.000% for 2022) and 14.657% (2021 – 15.650%) (minimum requirement – 14.000% for 2022) respectively, as at December 31, 2022, which are in excess of the higher capital adequacy requirement imposed on the Bank under the Basel III requirements as a Domestic Systemically Important Bank (D-SIB). The equity multiplier in terms of risk weighted assets to regulatory total capital increased to 6.82 times from 6.39 times a year ago.
As per the CBSL Basel III regulations, the Bank is one of the highest graded D-SIB, showcasing the Bank’s importance to the Sri Lankan economy.
Liquidity
The growth in deposits continued to outpace the growth in loans and advances during the current year as well, causing the Bank to invest the excess liquidity in Government securities. Nevertheless, at a time of unprecedented volatility such as what we currently experience, excess liquidity provides a high level of comfort to the Bank and also, enables the Bank to benefit from the upturn envisaged in credit demand in the years ahead. Given its importance, review of liquidity is a permanent item of the agenda in the fortnightly ALCO meetings of the Bank. The consolidated liquid assets ratio of the Sri Lankan operations of the Bank stood at 35.88% compared to the statutory minimum requirement of 20%.
The consolidated liquid assets ratio of the Sri Lankan operations of the Bank stood at 35.88% compare to the statutory minimum requirement of 20%. Liquid assets ratios of the Domestic Banking Unit (DBU) and the Off-shore Banking Centre (OBC) as at end of 2022, were 35.01% (2021 – 38.73%) and 32.37% (2021 – 36.39%) respectively. Gross loans to deposits ratio was 63.71% (2021 – 74.75%). Available stable funding based on definitions prescribed by the CBSL stood at Rs. 1.767 Tn., as at December 31, 2022 (2021 – Rs. 1.447 Tn.), leading to a Net Stable Funding Ratio (NSFR) of 173.58% (2021 – 157.47%), comfortably above the statutory minimum of 90% for the year 2022 (2021 – 100%). Demonstrating the availability of unencumbered high-quality liquid assets at the disposal of the Bank, the Liquidity Coverage Ratio (all currency) and the Liquidity Coverage Ratio (Rupee) stood at 293.91% (2021 – 242.52%) and at 405.91% (2021 – 425.97%) respectively, as at December 31, 2022 as against the statutory minimum of 90% for both ratios for the year 2022 (2021 – 100%).
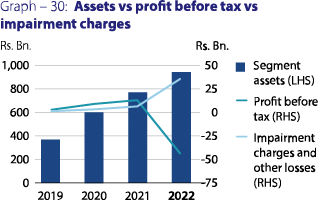
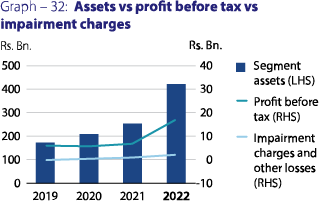
Segmental performance
The contribution from the Personal Banking Division to the profit before tax of the Group significantly increased mainly due to the increase in net interest income and net fee and commission income, while the contribution to the profit before tax of the Group from the Corporate Banking Division too increased in 2022, mainly due to the increase in net interest income and net fee and commission income despite a substantial increase in impairment charges and other losses. Further, the contribution from the International Operations to the profit before tax of the Group too increased by almost three times during 2022. In the meantime, the Bank’s Treasury division recorded a substantial loss for the year 2022, mainly due to additional impairment provisions o/a USD denominated Government Securities consequent to the downgrading of the sovereign rating of the country.
A comprehensive analysis on segmental performance is given below in this section.
The growth in deposits continued to outpace the growth in loans and advances during the current year as well, causing the Bank to invest the excess liquidity in Government securities. Nevertheless, at a time of unprecedented volatility such as what we currently experience, excess liquidity provides a high level of comfort to the Bank and also, enables the Bank to benefit from the upturn envisaged in credit demand in the years ahead.
The interim financial performance and the financial position of the Group and the Bank for 2021 and 2022 are given in the section on Statement of Financial Position while the Bank’s performance in terms of key indicators over the past ten year period is given in the section on “Decade at a Glance”.
Table – 24: Core Financial Soundness Indicators (FSIs)
Financial Soundness Indicators given below provide insights into the financial health and stability of the Bank.
| Financial soundness indicator (%) | 2022 | 2021 | 2020 | 2019 | 2018 |
| Capital Adequacy (under Basel III) | |||||
| Common Equity Tier 1 ratio (Current minimum requirement – 8.5%) | 11.39 | 11.92 | 13.22 | 12.30 | 11.34 |
| Tier 1 capital ratio (Current minimum requirement – 10%) | 11.39 | 11.92 | 13.22 | 12.30 | 11.34 |
| Total capital ratio (Current minimum requirement – 14%) | 14.66 | 15.65 | 16.82 | 16.15 | 15.60 |
| Non-performing loans (net of interest in suspense and specific provisions) to equity | N/A | 9.26 | 12.96 | 20.48 | 12.71 |
| Non-performing credit facilities (NPCF) [net of impairment] to equity | 33.56 | 26.69 | N/A | N/A | N/A |
| Asset quality: | |||||
| Gross NPL ratio (Based on regulatory provisions effective until December 31, 2021) | N/A | 4.62 | 5.11 | 4.95 | 3.24 |
| Net NPL ratio (Based on existing regulatory provisions effective until December 31, 2021) | N/A | 1.44 | 2.18 | 3.00 | 1.71 |
| Impaired loans (Stage 3) ratio (Based on existing regulatory provisions which includes undrawn commitments) |
5.25 | 3.85 | 6.78 | N/A | N/A |
| Impairment (Stage 3) to Stage 3 Loans Ratio (Based on existing regulatory provisions which includes undrawn commitments) |
39.60 | 42.76 | 30.87 | N/A | N/A |
| Total regulatory provisions ratio on gross loans and receivables (Based on regulatory provisions effective until December 31, 2021) |
N/A | 3.52 | 3.32 | 2.37 | 1.97 |
| Specific provision coverage ratio (Based on regulatory provisions effective until December 31, 2021) |
N/A | 68.93 | 57.42 | 39.39 | 47.21 |
| Provision coverage ratio (Based on SLFRS provisions) | 7.32 | 5.94 | 5.38 | 3.89 | 3.27 |
| Cost of risk of loans and advances | 1.80 | 1.35 | 1.88 | 1.09 | 0.91 |
| Open credit exposure ratio (Net exposure on NPCF as a % regulatory capital) | N/A | 8.79 | 11.88 | 17.37 | 10.21 |
| Open credit exposure ratio (Net exposure on NPCF as a % regulatory capital) | 34.41 | 25.33 | N/A | N/A | N/A |
| Earnings and profitability: | |||||
| Net interest income to total operating income | 61.51 | 70.69 | 66.15 | 71.51 | 70.56 |
| Net fee and commission income to total operating income | 14.67 | 12.86 | 12.35 | 15.59 | 15.95 |
| Other income to total operating income | 23.82 | 16.45 | 21.50 | 12.91 | 13.50 |
| Operating expenses to gross income | 12.68 | 17.96 | 16.99 | 17.10 | 17.00 |
| Impairment charge to total operating income | 53.78 | 27.02 | 28.67 | 16.76 | 13.46 |
| Cost to income ratio (including taxes on financial services) | 29.22 | 37.97 | 39.96 | 49.41 | 46.35 |
| Cost to income ratio (excluding taxes on financial services) | 26.29 | 31.61 | 33.95 | 38.51 | 36.85 |
| Financial intermediation margin (Gross income to average assets) | 12.59 | 8.73 | 9.59 | 11.05 | 11.28 |
| Interest margin (Net interest income to average assets) | 3.74 | 3.51 | 3.17 | 3.51 | 3.67 |
| Return on assets (ROA) – before income tax | 1.03 | 1.74 | 1.51 | 1.66 | 2.09 |
| Return on assets (ROA) – after income tax | 1.05 | 1.28 | 1.05 | 1.27 | 1.43 |
| Return on equity (ROE) | 12.46 | 14.66 | 11.28 | 13.54 | 15.56 |
| Liquidity: | |||||
| Statutory liquid assets ratio (Domestic Banking Unit) – (Current minimum requirement – 20%) |
35.01 | 38.73 | 44.99 | 30.42 | 24.47 |
| Statutory liquid assets ratio (Offshore Banking Unit) – (Current minimum requirement – 20%) |
32.37 | 36.39 | 32.70 | 25.25 | 30.20 |
| Liquidity Coverage Ratio (LCR) – Rupee – (Current minimum requirement – 90%) | 405.91 | 425.97 | 599.38 | 158.79 | 236.20 |
| Liquidity Coverage Ratio (LCR) – All currency – (Current minimum requirement – 90%) | 293.91 | 242.52 | 422.86 | 224.74 | 238.69 |
| Net Stable Funding Ratio (NSFR) – (Current minimum requirement – 90%) | 173.58 | 157.47 | 157.49 | 137.05 | 139.18 |
| CASA ratio (Current and Saving deposits as a % of total deposits) | 38.36 | 47.83 | 42.72 | 37.10 | 37.55 |
| Gross Loans and receivables to deposits ratio | 63.71 | 74.75 | 74.87 | 87.39 | 90.56 |
| Assets and funding structure: | |||||
| Deposits to gross loans and receivables | 156.96 | 133.78 | 133.56 | 114.43 | 110.43 |
| Deposits to total assets | 78.92 | 74.03 | 72.92 | 75.92 | 75.42 |
| Borrowings to total assets | 3.20 | 3.64 | 5.35 | 4.41 | 4.86 |
| Equity to total assets | 8.40 | 8.46 | 9.05 | 9.60 | 9.08 |
Segmental analysis
Personal Banking
- Highest contributor of the Group in terms of net interest income and net fee and commission income.
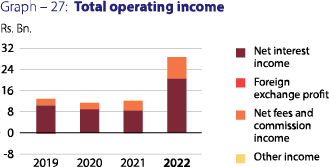
- Total operating income increased by 19.43% to Rs. 47.316 Bn. contributing almost 35% to the Group.
- Profit before tax increased by 32.80% to Rs. 16.427 Bn.
- Accounted for approximately one fourth of the assets of the Group as at end of 2022.
| Rs. Bn. | 2022 | 2021 | Change | Change as a % |
| Net interest income | 36.988 | 32.271 | 4.717 | 14.62 |
| Foreign exchange profit | 0.385 | 0.223 | 0.162 | 72.65 |
| Net fee and commission income | 9.214 | 6.469 | 2.745 | 42.43 |
| Other income | 0.729 | 0.655 | 0.074 | 11.30 |
| Total operating income | 47.316 | 39.618 | 7.698 | 19.43 |
| Impairment charges and other losses | (8.602) | (9.209) | 0.607 | -6.59 |
| Net operating income | 38.714 | 30.409 | 8.305 | 27.31 |
| Profit before tax | 16.427 | 12.370 | 4.057 | 32.80 |
| Segment assets | 620.050 | 589.421 | 30.629 | 5.20 |
Corporate Banking
- Significant Increase was recorded in net interest income and net fee and commission income by 139.23% and 132.51%, respectively.
- Impairment charges and other losses increased by 168.42% to Rs. 24.928 Bn.
- A growth of 135.26% in total operating income.
- Accounted for approximately one fifth of the assets of the Group as at end of 2022.
| Rs. Bn. | 2022 | 2021 | Change | Change as a % |
| Net interest income | 20.629 | 8.623 | 12.006 | 139.23 |
| Foreign exchange profit | 0.121 | 0.133 | (0.012) | -9.02 |
| Net fee and commission income | 8.017 | 3.448 | 4.569 | 132.51 |
| Other income | (0.029) | 0.011 | (0.040) | -363.64 |
| Total operating income | 28.739 | 12.216 | 16.523 | 135.26 |
| Impairment charges and other losses | (24.928) | (9.287) | (15.641) | 168.42 |
| Net operating income | 3.810 | 2.928 | 0.882 | 30.12 |
| Profit before tax | 1.098 | 0.604 | 0.494 | 81.79 |
| Segment assets | 498.406 | 426.522 | 71.884 | 16.85 |
Dealing/Treasury
- A sharp increase in impairment charges by 540.94% mainly due to additional impairment provisions made o/a USD denominated Government Securities consequent to the downgrading of the sovereign rating of the country.
- Growth in assets by 22.64% mainly due to the increase of foreign currency denominated assets as a result of rupee depreciation and excess liquidity being invested in treasury related operations.
- Treasury navigated through the challenging context by conducting derivative transactions, exploring opportunities for overseas expansions, expanding networking sessions, and launching an online platform for foreign exchange transactions.
| Rs. Bn. | 2022 | 2021 | Change | Change as a % |
| Net interest income | 3.214 | 13.923 | (10.709) | -76.92 |
| Foreign exchange profit | (7.823) | 5.696 | (13.519) | -237.34 |
| Net fee and commission income | 0.008 | 0.018 | (0.010) | -55.56 |
| Other income | (1.343) | 3.168 | (4.511) | -142.39 |
| Total operating income | (5.944) | 22.806 | (28.750) | -126.06 |
| Impairment charges and other losses | (37.053) | (5.781) | (31.272) | 540.94 |
| Net operating income | (42.997) | 17.025 | (60.022) | -352.55 |
| Profit before tax | (44.857) | 14.391 | (59.248) | -411.70 |
| Segment assets | 945.053 | 770.572 | 174.481 | 22.64 |
International operations
- Profit before tax increased by almost three times during 2022.
- A growth of 135.43% was recorded in the total operating income.
- Recorded highest exchange profit of Rs 8.752 Bn.
- The Bangladesh operation of the Bank made a noteworthy contribution of 91.65% of the profit before tax of international operations.
- Profit recorded by Commercial Bank of Maldives Private Limited for the year is the highest profit achieved by the Company in its 6-year history.
- The Bangladesh operation has become the best Regional Bank in performance in terms of deposits, advances and profitability.
| Rs. Bn. | 2022 | 2021 | Change | Change as a % |
| Net interest income | 14.051 | 6.913 | 7.138 | 103.25 |
| Foreign exchange profit | 8.757 | 1.959 | 6.798 | 347.01 |
| Net fee and commission income | 2.387 | 1.611 | 0.776 | 48.17 |
| Other income | 0.145 | 0.279 | (0.134) | -48.03 |
| Total operating income | 25.339 | 10.763 | 14.576 | 135.43 |
| Impairment charges and other losses | (1.091) | (0.477) | (0.614) | 128.72 |
| Net operating income | 24.248 | 10.286 | 13.962 | 135.74 |
| Profit before tax | 17.424 | 6.412 | 11.012 | 171.74 |
| Segment assets | 422.835 | 254.416 | 168.419 | 66.20 |
NBFI, Real Estate and Services
- Highest contribution to the other sources of income of the Group.
- CBC Tech Solutions Limited was appointed as a retail partner by Lenovo which is a Fortune 500 technology company.
- CBC Tech was the first Sri Lankan company to import the Lenovo Think Centre Neo desktop computers powered by 12th generation Intel® Core™ processors in June 2022.
| Rs. Bn. | 2022 | 2021 | Change | Change as a % |
| Net interest income | 0.679 | 0.767 | (0.088) | -11.47 |
| Foreign exchange profit | 0.002 | – | 0.002 | N/A |
| Net fee and commission income | 0.180 | 0.265 | (0.085) | -32.08 |
| Other income | 1.369 | 1.069 | 0.300 | 28.06 |
| Total operating income | 2.230 | 2.100 | 0.130 | 6.19 |
| Impairment charges and other losses | (0.249) | (0.386) | 0.137 | -35.49 |
| Net operating income | 1.981 | 1.714 | 0.267 | 15.58 |
| Profit before tax | 0.542 | 0.636 | (0.094) | -14.78 |
| Segment assets | 14.566 | 13.386 | 1.180 | 8.82 |
Performance of the overseas operations, subsidiaries, and the associate
Performance of the Bangladesh Operations will have to be reviewed in the context of the Operating Context and Outlook .
Commercial Bank of Ceylon PLC (CBC) commenced its operations in Bangladesh (CBC Bangladesh) by acquiring the banking business of Credit Agricole Indosuez, a French multi-national Bank, in November 2003.
During the past 19 years of operations, CBC Bangladesh has established its position well above the other Regional Banks operating in the country with 20 operating units which includes 11 Branches, 1 Sub Branch, 6 SME Centers and 2 Offshore Banking Units.
As at end of 2022, CBC Bangladesh owned Twenty-four ATM machines (including seven in off-site locations). In addition, an Automated Banking Centre (ABC) comprising a real time Cash Deposit Machine, Cheque Deposit Machine, KIOSK machine and a digital signage has been established in its Motijheel Branch.
CBC Bangladesh has become the best Regional Bank in performance (deposits, advances and profitability) by providing excellent service and commitments focusing the following areas:
Corporate Banking: has established its name as a premier regional bank from the inception offering exceptional relationship banking to corporate banking customers, thereby expanding the corporate banking portfolio multi-fold.
Consumer Banking: has plans to become a preferred Retail, SME and Credit Cards provider for the target market through a superior IT platform and innovative products, helping it to achieve a healthy deposit mix with a strong savings base.
Treasury Management: Provides consistent and efficient fund management through superior expertise with diversified and novel treasury products.
Human Resources: one of the most preferred employers in the banking industry by providing excellent opportunities for training and development.
Digital Banking: introduced a technologically advanced Digital Banking Product branded e-passbook, which is unique in the country, PayMaster, for the corporate clients to ensure smooth daily operations. Also introduced Two Factor Authentication system for all online transactions without physical cards, e-statement & Over the air pin (OTAP) for Credit Cards and Internet Banking for Corporate and Retail Banking Customers with several new features.
At present, CBC Bangladesh has its presence in five main districts in the country i.e. Dhaka, Chittagong, Sylhet, Narayanganj and Gazipur. Despite the severe competition among the international and large local banks, CBC Bangladesh has recorded a consistent growth in its business volumes, specially by catering to multinationals and large local corporates by offering superior services and commitments. With the expansion of the branch network, CBC Bangladesh operations has managed to attract more SME and Retail clientele to the Bank, enabling it to improve its low cost deposit base resulting in lower cost of funds and improved profitability.
During 2022, CBC Bangladesh upgraded Internet Banking System with various new features and some of them are for the first time in Bangladesh. Several new initiatives such as e-Leave and e-Attendance Systems, revamping of Corporate Website, Call Centre Solution, integration with National Payment System Bangladesh (NPSB) etc. have been effected in addition to inclusion of several new features for existing products and services.
The progress of the CBC Bangladesh operations in core banking areas over the past five years is summarised below:
Table 25: Key Performances Indicators – Bangladesh Operations
| Indicator | 2022 BDT Mn. |
2021 BDT Mn. |
2020 BDT Mn. |
2019 BDT Mn. |
2018 BDT Mn. |
5-Year CAGR (%) |
| Total deposit | 71,243.10 | 64,959.50 | 50,997.50 | 45,362.98 | 35,221.65 | 19.85 |
| Gross advances | 51,561.50 | 58,110.88 | 55,039.33 | 47,449.60 | 38,448.10 | 9.93 |
| Profit before tax | 5,424.90 | 3,035.35 | 2,898.24 | 2,744.68 | 2,440.56 | 25.27 |
| Profit after tax | 2,954.40 | 1,744.11 | 1,709.47 | 1,697.40 | 1,407.23 | 24.48 |
Table 26: Key Financial Ratios – Bangladesh Operations (based on management accounts)
| Indicator | 2022 | 2021 | 2020 | 2019 | 2018 |
| Cost/Income ratio (%) | 16.47 | 23.68 | 24.76 | 24.74 | 25.27 |
| Net interest margin (%) | 4.05 | 3.21 | 4.01 | 4.27 | 4.53 |
| Profit per employee (BDT Mn.) | 16.95 | 10.25 | 9.96 | 8.65 | 8.16 |
| ROA (%) | 5.61 | 3.20 | 3.46 | 3.53 | 4.31 |
| ROE (%) | 17.95 | 12.24 | 13.32 | 14.82 | 13.97 |

Mr Najith Meewanage, CEO, Bangladesh, receiving the Top 10 Best Business Leaders Award
During the year 2022 too, the CBC Bangladesh won a number of awards and accolades including the following:
- Best Foreign Bank in Bangladesh – 2022 by Global Economic Limited, UK-based magazine for 3rd consecutive year.
- Most Recommended Foreign Bank in Bangladesh – 2022 by World Business Outlook, a Singapore-based magazine for 2nd consecutive year.
- Most Sustainable Bank in Bangladesh – 2022 by International Business Magazine, UAE for 2nd consecutive year
- Best Corporate Bank Bangladesh – 2022 by Global Business Review Magazine, UAE.
- Best Foreign Bank in Bangladesh – 2022 by World Economic Magazine, USA based magazine
One of the key events during the year was that Mr Najith Meewanage - Chief Executive Officer of the Bangladesh Operations being selected as one of the Top 10 Best Business Leaders in Bangladesh - 2022 by CEO Insights Magazine, India.
In addition, a special commendation letter was awarded by the Central Bank of Bangladesh for disbursing the full allocation of the stimulus package to the SME sector during the year 2022 as well while another special award was awarded by the Large Tax Payer Unit (LTU) of National Board of Revenue (NBR), Bangladesh for being one of the highest tax payers of the country.
Meanwhile, the Credit Rating Information and Services Ltd. (CRISL) rated CBC Bangladesh operations AAA for the 12th consecutive year based on the financial performance for 2021.
Subsidiaries and associate of the Group
Given below is a brief overview of the operations of the subsidiaries and the associate of the Bank.
Local subsidiaries
Commercial Development Company PLC (CDC)
Established in 1980 as the Bank’s first subsidiary, CDC owns the Head Office building of Commercial Bank, “Commercial House”, and has two other properties in Negombo and Tangalle. The Bank holds a stake of 90% in CDC.
CDC is the only listed Subsidiary of the Group, with a market capitalisation of Rs. 1.146 Bn. as of end 2022 (2021: Rs. 1.632 Bn). The principal business activities of CDC include renting of premises, hiring of vehicles, outsourcing of non-core staff and provision of other utility services to the Bank.
CDC recorded a post-tax profit of Rs. 224.378 Mn. for the year 2022, compared to Rs. 401.506 Mn. reported in 2021. The drop in profits was mainly due to increase in deferred tax provision on the cumulative fair value gains recognised on Investment Property consequent to the increase in the corporate tax rate to 30% from 24%. The income from core business activities of the Company amounted to Rs. 631.128 Mn. which reflected marginal drop of 0.18%, while the profit before tax for the year amounted to Rs. 401.289 Mn., compared to Rs. 427.265 Mn., recorded for 2021, primarily due to a reduction in the fair value gains on investment properties of Rs. 24.629 Mn. The total assets of the Company crossed the Rs. 4 Bn., mark and stood at Rs.4.055 Bn., as at end of 2022 compared to Rs. 3.785 Bn., as at end 2021.
CBC Tech Solutions Limited
CBC Tech Solutions Limited is a fully owned subsidiary of the Bank and provides Information Technology services and solutions to the Bank, its subsidiaries and to a few selected corporates.
The main lines of business of CBC Tech Solutions are providing Information Technology support, supply of hardware, licensed software, hardware maintenance, Point of Sale (POS) maintenance, software development, and outsourcing of professional and skilled manpower to the Bank.
At present, the Company operates from five regional support centers in Colombo, Galle, Kandy, Jaffna and Badulla to ensure prompt services.
During 2022, the Company continued with its island wide Personal computer/server maintenance, Point of Sales machines troubleshooting, and first level technical support for the Bank. Furthermore, the Company embarked on new service line by undertaking the maintenance of Passbook printers to further strengthen the bottom line during the year. The Software development unit completed many projects, developed a few customer centric products, and also penetrated in to several foreign customers in 2022. The Company further upskilled its employees and outsourced them to the subsidiaries of the Bank.
The Company was appointed as a retail partner by Lenovo which is a Fortune 500 technology company. Consequent to this partnership, the Company is an agent for Lenovo’s range of personal computers, tablets and accessories, including the IdeaPad, Yoga, Legion and ThinkPad series. Notably, CBC Tech was the first Sri Lankan company to import the Lenovo Think Centre Neo desktop computers powered by 12th generation Intel® Core™ processors in June 2022.
The Company recorded a total revenue of Rs. 647.408 Mn., for the year 2022, with a growth of 82.72% compared to Rs. 354.303 Mn., recorded in 2021. The substantial growth in income was mainly due to the higher hardware sales. The pre-tax profit of the Company for the year stood at Rs.186.761 Mn., as against Rs. 156.761 Mn., reported in 2021, which recorded a growth of 19.14%. The post-tax profit amounted to Rs. 171.725 Mn., for the year 2022 compared to Rs. 181.134 Mn., reported for 2021, a drop of 5.19%. However, after discounting for the effect of drop in taxes which was accounted in 2021, based on the normalised profit for 2021, the Company recorded a growth 12.99% in 2022. The Company aims to emerge as one of the leading innovative ICT solutions providers in Sri Lanka, having a mission to deliver the most reliable, customer-centric ICT products and services to drive technological innovations.
CBC Finance Limited (CBCF)
CBC Finance Ltd (CBCF) is a fully owned subsidiary of the Bank and is a Licensed Finance Company (LFC) under the Finance Business Act No. 42 of 2011. After changing the brand name from Serendib Finance Ltd to CBC Finance Ltd, the Company embarked on an aggressive image-enhancing campaign and further strengthened the governance structure and synergies with the parent Company, Commercial Bank of Ceylon PLC.
The unprecedented macroeconomic conditions that prevailed during the year exerted tremendous pressure on the entire finance industry, making it very challenging for all our customers, irrespective of their ticket size. Nevertheless, the Company was able to increase its gross income for 2022 by 29% to Rs. 1.636 Bn. However, there was a substantial impact from the increased cost of funds from Rs. 443 Mn., in 2021 to Rs. 986 Mn., in 2022. Consequently, the Company’s net operating income decreased from Rs. 431 Mn., in 2021 to Rs. 390 Mn. for the current year. The other operating income increased to Rs. 61 Mn., in 2022 from Rs. 50 Mn., in 2021. However, the Profit for the year decreased to Rs. 39 Mn., compared to the figure of Rs. 51 Mn., last year due to the prudent provisions made considering the high-risk segments of the portfolio. The drive for the canvassing of deposits continued with stiff competition, and the year-end portfolio stood at Rs. 5.116 Bn., due to timely measures taken for retaining deposit liabilities with minor cost impact to the bottom line.
While accepting the challenge of growing the portfolios in an unprecedented market, the Company’s total assets increased to Rs.10.954 Bn., from Rs. 10.311 Bn., recorded for 2021, mainly due to its core product - finance leasing business growing to Rs. 2.129 Bn., from Rs. 1.771 Bn., in 2021. The Company’s Gross NPA ratio of 16.98% was on par with the industry.
During the year, the Company relocated Kaduruwela Branch to provide a better customer experience. In addition, with the approval granted by the Central Bank of Sri Lanka to open ten new branches, the Company expanded the delivery channels by opening branches in Trincomalee, Vavuniya and Batticaloa and is planning to open another three branches in the year 2023 in strategically important business areas to enhance its presence.
Commercial Insurance Brokers (Pvt) Ltd. (CIBL)
The Bank has a stake in CIBL of 60%. The principal business activity of CIBL is insurance brokering for all types of insurance through reputed life and general insurance companies in Sri Lanka.
CIBL recorded a post-tax profit of Rs. 32.435 Mn. for the year ended December 31, 2022, with a growth of 7.09% compared to Rs. 30.286 Mn. recorded in 2021. The CIBL’s total assets stood at Rs. 720.928 Mn. as at December 31, 2022, compared to the total assets of Rs. 705.396 Mn., a year ago.
Local associate
Equity Investments Lanka Ltd. (EQUILL)
The Bank owns a 22.92% stake in EQUILL, a venture capital company established 32 years ago. EQUILL invests in equity and equity-featured debt instruments.
The Company recorded a loss of Rs 16.263 Mn. in 2022 as against the post-tax profit of Rs. 8.272 Mn. reported in 2021.
Foreign subsidiaries
Commercial Bank of Maldives Private Limited (CBM)
In partnership with Tree Top Investments (TTI), CBM was founded in the Republic of Maldives as the second foreign subsidiary of the Bank. TTI contributes vital local market knowledge to the Company and has a stake of 45%, while the Bank holds a 55% stake in the Company. Established during the latter part of 2016, CBM set up its Head Office and first branch in the capital, Malé and by end of 2017, CBM opened its second branch in Hulhumale.
While offering an extensive range of financial services, CBM’s vision is “to be the trusted financial service provider for growth, delivering excellence in service quality”. CBM is seen as the most technologically advanced, innovative, customer friendly, and the most sought-after financial service organisation in the Republic of Maldives.
CBM has invested heavily on its Open Banking project during the year 2022 and wishes to maximise the usage of interoperability capabilities in the platform by developing the most advanced App in the market, once the services are launched in 2023.
By end of December 31, 2022, CBM managed to increase its total deposit base to MVR 2,542.4 Mn., from MVR 1,993.4 Mn., as at end December 31, 2021, which is a growth of MVR 549.0 Mn or 27.54%. Further, during the year CBM managed to increase its loans and advances portfolio by MVR 195.1 Mn., or by 33.09% and it stood at MVR 785.6 Mn., as at December 31, 2022, compared to MVR 589.7 Mn., a year ago.
During the year 2022, CBM recorded a post-tax profit of MVR 53.75 Mn., compared to the post-tax profit of MVR 32.84 Mn. reported in 2021. Profit recorded in the current year is the highest profit achieved by the Company in the operation of its 6-year history.
Bank's International Operations in terms of branches in Bangladesh and subsidiaries in the Maldives and Myanmar helped the Bank to geographically diversify its operations which made a significant contribution to the profit before tax of the Group in the year under review.
CBC Myanmar Microfinance Company (CBC Myanmar)
CBC Myanmar was established in July 2018 with the opening of its Head Office and a branch in Lewe Township in Nay Pyi Taw as a fully owned subsidiary of the Bank with the focus of capitalising on opportunities in the Microfinance sector. After securing a permanent business license in 2021, the Company expanded its operations to Aye Lar, Zabuthiri, and Pyinmana townships.
Myanmar economy was projected to grow by 3% following a 18% contraction in 2021. The GDP for 2022 estimated to be around 13% but still lower than the GDP recorded for 2019.
The CBC Myanmar started the year with 80% of its portfolio in Portfolio at Risk (PAR). As a result of persistent recovery actions throughout the year, the Company was able to achieve a PAR of 27.7% towards the year-end while the industry PAR was well above 30%.
In November 2022, CBC Myanmar managed to obtain a credit facility of MMK 1.5 Bn., through United Amara Bank of Myanmar against a Standby Letter of Credit facility of USD 1 Mn., issued by the parent company to maintain credit growth as further capital infusion was not possible.
Overall, the Company was able increase its interest income substantially with improvement of portfolio quality and with a gradual growth in the loan book. However, the break-even target of the Company got further delayed due to sharp currency depreciation as a significant portion of Company’s expenses are paid in USD.
A special provision of MMK 398.86 Mn., (USD 189,932) was made as measure of prudency above the regulatory requirements to meet possible write offs in ensuing months for the loans in arrears during the period of pandemic and political instability.
The Company disbursed MMK 3.7 Bn. in new loans during 2022 despite the challenges in the operating environment and reported a loss of MMK 333Mn. during the financial year ended December 31, 2022 compared to a profit of MMK 247 Mn. during the previous financial year. Identifying the need for digital platforms to facilitate recoveries, the Company has initiated to partner with leading digital wallet share providers.
The Company is optimistic that the current economic conditions would gradually improve enabling the Company to enter in to profit zone in the second half of 2023. The Company has planned to expand into another region and also to open more branches in the Nay Pyi Taw region if the conditions improve in 2023.
Commex Sri Lanka S.R.L. (Commex)
Commex, a fully-owned subsidiary of the Bank, commenced business under the Authorised Payments Institute (API) license issued by the Bank of Italy in 2016. However, during the year 2022, the Board of Directors of Commex decided to voluntarily liquidate the Company owing to the economic impact of COVID-19 and announcement to that effect was made by the Bank to the Colombo Stock exchange. During the year 2022, Commex recorded a loss of Rs.19.804 Mn.
The details of the Group companies together with a summary of key financial information for each company is given in the section on “Group Structure”.
Summary of Interim Financial Statements Income Statement – Group and Bank – 2022 and 2021
| 1st Quarter ended March 31 | 2nd Quarter ended June 30 | 3rd Quarter ended September 30 | 4th Quarter ended December 31 | Total | ||||||
| 2022 | 2021 | 2022 | 2021 | 2022 | 2021 | 2022 | 2021 | 2022 | 2021 | |
| Rs. ’000 | Rs. ’000 | Rs. ’000 | Rs. ’000 | Rs. ’000 | Rs. ’000 | Rs. ’000 | Rs. ’000 | Rs. ’000 | Rs. ’000 | |
| Group | ||||||||||
| Net interest income | 18,823,025 | 15,476,721 | 21,889,560 | 15,681,311 | 22,101,235 | 16,375,248 | 21,851,391 | 18,883,052 | 84,665,211 | 66,416,332 |
| Net fee and commission income | 4,087,687 | 3,023,322 | 4,789,815 | 2,688,925 | 5,035,555 | 2,884,472 | 6,256,044 | 3,645,475 | 20,169,101 | 12,242,194 |
| Other operating income (net) | 11,333,380 | 5,660,582 | 8,308,652 | 3,813,475 | 7,468,511 | 3,347,432 | 4,691,792 | 2,118,308 | 31,802,335 | 14,939,797 |
| Less: Impairment charges and other losses | 5,960,556 | 7,156,050 | 29,258,063 | 6,498,391 | 17,052,988 | 4,342,977 | 19,652,653 | 7,142,508 | 71,924,260 | 25,139,926 |
| Net operating income | 28,283,536 | 17,004,575 | 5,729,964 | 15,685,320 | 17,552,313 | 18,264,175 | 13,146,574 | 17,504,327 | 64,712,387 | 68,458,397 |
| Less: Expenses | 11,875,805 | 8,600,269 | 8,758,423 | 8,336,383 | 8,893,074 | 8,950,689 | 10,676,320 | 9,615,628 | 40,203,622 | 35,502,969 |
| Operating profit | 16,407,731 | 8,404,306 | (3,028,459) | 7,348,937 | 8,659,239 | 9,313,486 | 2,470,254 | 7,888,699 | 24,508,765 | 32,955,428 |
| Add: Share of profits/(losses) of associate companies | (1,869) | (133) | (1,607) | 546 | 1,220 | (330) | (1,471) | 1,813 | (3,727) | 1,896 |
| Profit before income tax | 16,405,862 | 8,404,173 | (3,030,066) | 7,349,483 | 8,660,459 | 9,313,156 | 2,468,783 | 7,890,512 | 24,505,038 | 32,957,324 |
| Less: Income tax expense | 4,631,158 | 1,606,916 | (433,112) | 1,793,203 | 2,377,804 | 2,649,350 | (6,470,284) | 2,617,567 | 105,566 | 8,667,036 |
| Profit for the period | 11,774,704 | 6,797,257 | (2,596,954) | 5,556,280 | 6,282,655 | 6,663,806 | 8,939,067 | 5,272,945 | 24,399,472 | 24,290,288 |
| Quarterly profit as a percentage of the profit after tax | 48.3 | 28.0 | (10.6) | 22.9 | 25.7 | 27.4 | 36.6 | 21.7 | 100.0 | 100.0 |
| Cumulative quarterly profit as a percentage of the profit after tax | 48.3 | 28.0 | 37.6 | 50.9 | 63.4 | 78.3 | 100.0 | 100.0 | – | – |
| Bank | ||||||||||
| Net interest income | 18,294,991 | 15,051,903 | 21,131,976 | 15,226,162 | 21,283,570 | 15,934,934 | 21,033,493 | 18,397,613 | 81,744,030 | 64,610,612 |
| Net fee and commission income | 3,962,233 | 2,886,892 | 4,618,230 | 2,570,984 | 4,882,230 | 2,803,989 | 6,028,575 | 3,489,598 | 19,491,268 | 11,751,463 |
| Other operating income (net) | 11,355,289 | 5,692,641 | 8,308,491 | 3,806,422 | 7,484,902 | 3,345,805 | 4,504,448 | 2,187,582 | 31,653,130 | 15,032,450 |
| Less: Impairment charges and other losses | 5,869,091 | 7,052,038 | 29,091,260 | 6,306,004 | 16,951,155 | 4,261,500 | 19,550,116 | 7,072,801 | 71,461,622 | 24,692,343 |
| Net operating income | 27,743,422 | 16,579,398 | 4,967,437 | 15,297,564 | 16,699,547 | 17,823,228 | 12,016,400 | 17,001,992 | 61,426,806 | 66,702,182 |
| Less: Expenses | 11,654,722 | 8,396,219 | 8,480,267 | 8,061,141 | 8,626,581 | 8,818,226 | 10,066,851 | 9,425,393 | 38,828,421 | 34,700,979 |
| Profit before income tax | 16,088,700 | 8,183,179 | (3,512,830) | 7,236,423 | 8,072,966 | 9,005,002 | 1,949,549 | 7,576,599 | 22,598,385 | 32,001,203 |
| Less: Income tax expense | 4,541,083 | 1,525,107 | (557,428) | 1,760,639 | 2,226,823 | 2,533,250 | (6,581,884) | 2,576,156 | (371,406) | 8,395,152 |
| Profit for the period | 11,547,617 | 6,658,072 | (2,955,402) | 5,475,784 | 5,846,143 | 6,471,752 | 8,531,433 | 5,000,443 | 22,969,791 | 23,606,051 |
| Quarterly profit as a percentage of the profit after tax | 50.3 | 28.2 | (12.9) | 23.2 | 25.5 | 27.4 | 37.1 | 21.2 | 100.0 | 100.0 |
| Cumulative quarterly profit as a percentage of the profit after tax | 50.3 | 28.2 | 37.4 | 51.4 | 62.9 | 78.8 | 100.0 | 100.0 | – | – |
Statement of Financial Position – Group – 2022 and 2021
| 1st Quarter ended | 2nd Quarter ended | 3rd Quarter ended | 4th Quarter ended | |||||
| As at | March 31, 2022 Rs. ’000 |
March 31, 2021 Rs. ’000 |
June 30, 2022 Rs. ’000 |
June 30, 2021 Rs. ’000 |
September 30, 2022 Rs. ’000 |
September 30, 2021 Rs. ’000 |
December 31, 2022 (Audited) Rs. ’000 |
December 31, 2021 (Audited) Rs. ’000 |
| Assets | ||||||||
| Cash and cash equivalents | 139,725,913 | 51,995,270 | 107,999,772 | 67,888,744 | 117,183,269 | 93,000,346 | 151,109,490 | 69,335,379 |
| Balances with Central Banks | 87,849,345 | 79,603,760 | 51,501,124 | 84,715,615 | 60,156,210 | 49,431,255 | 78,597,120 | 56,777,465 |
| Placements with banks | 5,882,556 | 13,834,678 | 18,313,838 | 7,625,796 | 57,528,580 | 20,218,425 | 96,082,937 | 12,498,709 |
| Securities purchased under re-sale agreements | 1,756,293 | – | 2,002,143 | – | – | 2,697,359 | 1,517,308 | 3,000,490 |
| Derivative financial assets | 24,426,913 | 3,633,738 | 23,674,635 | 3,105,697 | 8,336,323 | 3,271,766 | 8,345,091 | 3,245,120 |
| Financial assets recognised through profit or loss – measured at fair value | 25,090,307 | 25,982,011 | 54,201,704 | 34,171,453 | 42,638,708 | 31,522,053 | 24,873,057 | 23,436,123 |
| Financial assets at amortised cost – Loans and advances to banks | – | 829,740 | 837,037 | 833,952 | ||||
| Financial assets at amortised cost – Loans and advances to other customers | 1,158,500,812 | 929,618,154 | 1,219,947,845 | 971,894,929 | 1,159,104,807 | 999,913,656 | 1,155,492,527 | 1,029,584,075 |
| Financial assets at amortised cost – Debt and other financial instruments | 451,890,370 | 350,832,246 | 770,170,847 | 375,044,696 | 744,530,469 | 356,179,525 | 761,650,234 | 385,390,598 |
| Financial assets measured at fair value through other comprehensive income | 316,414,558 | 315,079,615 | 71,383,043 | 335,866,978 | 108,526,607 | 345,560,552 | 118,652,257 | 335,953,802 |
| Investments in subsidiaries | – | – | – | – | – | – | – | - |
| Investment in associate | 57,656 | 63,111 | 55,628 | 63,749 | 57,053 | 63,096 | 55,302 | 60,428 |
| Property, plant and equipment and right-of-use assets | 25,535,145 | 25,674,949 | 25,830,332 | 25,232,279 | 25,881,016 | 25,001,485 | 27,446,607 | 24,744,634 |
| Investment properties | 72,400 | 67,116 | 72,400 | 67,900 | 72,400 | 67,900 | 80,350 | 72,400 |
| Intangible assets | 2,505,708 | 1,914,792 | 2,653,532 | 1,868,300 | 3,303,890 | 2,047,091 | 4,113,200 | 2,272,639 |
| Leasehold property | – | – | – | – | – | – | – | - |
| Deferred tax assets | 16,467,507 | 4,187,627 | 15,604,218 | 5,173,206 | 18,688,275 | 8,052,166 | 30,727,213 | 10,036,105 |
| Other assets | 30,384,439 | 20,983,814 | 40,069,160 | 21,168,312 | 44,293,042 | 24,600,114 | 40,811,211 | 27,083,177 |
| Total assets | 2,286,559,922 | 1,824,300,621 | 2,403,480,221 | 1,934,724,691 | 2,390,300,649 | 1,962,460,741 | 2,499,553,904 | 1,983,491,144 |
| Liabilities | ||||||||
| Due to banks | 78,825,477 | 80,049,153 | 64,607,923 | 103,006,874 | 65,021,690 | 80,540,568 | 64,971,170 | 73,801,195 |
| Derivative financial liabilities | 13,445,927 | 4,388,511 | 8,640,775 | 2,609,946 | 4,350,184 | 3,017,891 | 2,880,667 | 2,092,198 |
| Securities sold under repurchase agreements | 168,475,481 | 96,228,787 | 214,906,611 | 113,577,165 | 129,659,272 | 132,578,610 | 97,726,435 | 151,424,854 |
| Financial liabilities at amortised cost – Due to depositors | 1,706,467,472 | 1,346,539,936 | 1,756,807,475 | 1,405,045,018 | 1,853,469,051 | 1,447,888,478 | 1,977,743,661 | 1,472,640,456 |
| Financial liabilities at amortised cost – Other borrowings | 32,042,811 | 52,098,343 | 30,611,911 | 50,377,494 | 20,905,990 | 46,167,470 | 16,150,356 | 32,587,051 |
| Current tax liabilities | 13,745,921 | 7,588,842 | 17,887,416 | 8,775,280 | 19,391,280 | 8,737,272 | 24,916,074 | 9,486,772 |
| Deferred tax liabilities | 348,851 | 344,928 | 348,867 | 344,335 | 349,849 | 343,822 | 437,123 | 349,106 |
| Other liabilities | 52,266,429 | 39,132,442 | 57,394,541 | 46,354,848 | 41,904,727 | 31,862,811 | 40,354,877 | 33,253,518 |
| Due to subsidiaries | – | – | – | – | – | – | – | - |
| Subordinated liabilities | 45,117,068 | 34,239,946 | 50,868,395 | 34,704,218 | 50,935,604 | 43,363,999 | 61,400,967 | 38,303,466 |
| Total liabilities | 2,110,735,437 | 1,660,610,888 | 2,202,073,914 | 1,764,795,178 | 2,185,987,647 | 1,794,500,921 | 2,286,581,330 | 1,813,938,616 |
| Equity | ||||||||
| Stated capital | 58,149,621 | 54,564,038 | 58,149,621 | 54,565,350 | 58,149,621 | 54,565,494 | 58,149,621 | 54,566,957 |
| Statutory reserves | 10,590,338 | 9,287,728 | 10,590,338 | 9,287,728 | 10,590,338 | 9,287,728 | 12,079,670 | 10,590,338 |
| Retained earnings | 12,625,944 | 7,254,535 | 4,689,644 | 12,848,919 | 10,795,707 | 19,680,594 | 6,790,304 | 9,890,762 |
| Other reserves | 91,496,084 | 90,696,736 | 124,232,206 | 91,273,009 | 120,834,984 | 82,402,906 | 131,845,571 | 92,426,660 |
| Total equity attributable to equity holders of the Group/Bank | 172,861,987 | 161,803,037 | 197,661,809 | 167,975,006 | 200,370,650 | 165,936,722 | 208,865,166 | 167,474,717 |
| Non-controlling interest | 2,962,498 | 1,886,696 | 3,744,498 | 1,954,507 | 3,942,352 | 2,023,098 | 4,107,408 | 2,077,811 |
| Total equity | 175,824,485 | 163,689,733 | 201,406,307 | 169,929,513 | 204,313,002 | 167,959,820 | 212,972,574 | 169,552,528 |
| Total liabilities and equity | 2,286,559,922 | 1,824,300,621 | 2,403,480,221 | 1,934,724,691 | 2,390,300,649 | 1,962,460,741 | 2,499,553,904 | 1,983,491,144 |
| Contingent liabilities and commitments | 859,963,467 | 800,865,904 | 723,286,189 | 744,326,170 | 600,709,801 | 674,796,325 | 555,531,537 | 685,379,028 |
| Net assets value per ordinary share (Rs.) | 139.43 | 135.49 | 159.43 | 140.66 | 161.62 | 138.95 | 168.47 | 140.24 |
| Quarterly growth (%) | ||||||||
| Financial assets at amortised cost – Loans and advances to banks & loans and advances to other customers | 12.52 | 2.18 | 5.30 | 4.55 | –4.99 | 2.88 | –0.31 | 2.97 |
| Financial liabilities at amortised cost – Due to depositors | 15.88 | 4.66 | 2.95 | 4.34 | 5.50 | 3.05 | 6.70 | 1.71 |
| Total assets | 15.28 | 3.51 | 5.11 | 6.05 | –0.55 | 1.43 | 4.57 | 1.07 |
Statement of Financial Position – Bank – 2022 and 2021
| 1st Quarter ended | 2nd Quarter ended | 3rd Quarter ended | 4th Quarter ended | |||||
| As at | March 31, 2022 Rs. ’000 |
March 31, 2021 Rs. ’000 |
June 30, 2022 (Audited) Rs. ’000 |
June 30, 2021 (Audited) Rs. ’000 |
September 30, 2022 Rs. ’000 |
September 30, 2021 Rs. ’000 |
December 31, 2022 (Audited) Rs. ’000 |
December 31, 2021 (Audited) Rs. ’000 |
| Assets | ||||||||
| Cash and cash equivalents | 138,554,687 | 50,223,404 | 106,644,408 | 66,211,229 | 115,987,885 | 91,478,737 | 149,393,611 | 68,078,076 |
| Balances with Central Banks | 81,086,848 | 76,341,432 | 45,197,919 | 80,197,728 | 50,225,992 | 45,873,467 | 66,493,499 | 52,897,908 |
| Placements with banks | 4,580,100 | 13,313,090 | 17,327,567 | 7,082,629 | 56,536,485 | 19,265,858 | 95,899,645 | 11,584,952 |
| Securities purchased under re-sale agreements | 1,756,293 | – | 2,002,143 | – | – | 2,697,359 | 1,517,308 | 3,000,490 |
| Derivative financial assets | 24,426,913 | 3,633,738 | 23,674,635 | 3,105,697 | 8,336,323 | 3,271,766 | 8,345,091 | 3,245,120 |
| Financial assets recognised through profit or loss – measured at fair value | 25,090,307 | 25,982,011 | 54,201,704 | 34,171,453 | 42,638,708 | 31,522,053 | 24,873,057 | 23,436,123 |
| Financial assets at amortised cost – Loans and advances to banks | 829,740 | 837,037 | 833,952 | |||||
| Financial assets at amortised cost – Loans and advances to other customers | 1,139,304,710 | 916,062,889 | 1,197,683,170 | 957,384,317 | 1,136,121,535 | 984,845,846 | 1,130,442,579 | 1,014,618,580 |
| Financial assets at amortised cost – Debt and other financial instruments | 424,805,507 | 337,216,097 | 730,882,224 | 361,301,611 | 708,272,738 | 342,169,712 | 725,935,299 | 369,417,889 |
| Financial assets measured at fair value through other comprehensive income | 315,781,767 | 314,567,633 | 69,648,186 | 335,862,629 | 106,976,948 | 345,250,606 | 117,056,240 | 335,463,338 |
| Investments in subsidiaries | 5,808,429 | 5,808,429 | 5,808,429 | 5,808,429 | 5,808,429 | 5,808,429 | 5,808,429 | 5,808,429 |
| Investment in associate | 44,331 | 44,331 | 44,331 | 44,331 | 44,331 | 44,331 | 44,331 | 44,331 |
| Property, plant and equipment and right-of-use assets | 23,719,230 | 23,997,196 | 23,872,579 | 23,544,270 | 23,852,100 | 23,246,255 | 25,425,452 | 23,075,467 |
| Investment properties | – | – | – | – | – | – | – | – |
| Intangible assets | 1,941,213 | 1,330,727 | 2,084,157 | 1,311,076 | 2,745,081 | 1,494,505 | 3,563,120 | 1,724,864 |
| Leasehold property | – | – | – | – | – | – | – | – |
| Deferred tax assets | 16,169,713 | 3,971,770 | 15,274,931 | 4,917,109 | 18,355,515 | 7,772,486 | 30,301,203 | 9,793,129 |
| Other assets | 30,285,171 | 20,879,920 | 39,964,157 | 21,108,274 | 44,160,287 | 24,542,510 | 40,699,168 | 27,024,475 |
| Total assets | 2,233,355,219 | 1,794,202,407 | 2,334,310,540 | 1,902,887,819 | 2,320,062,357 | 1,930,117,872 | 2,425,798,032 | 1,949,213,171 |
| Liabilities | ||||||||
| Due to banks | 78,898,400 | 79,383,054 | 64,643,031 | 102,474,262 | 65,126,753 | 80,362,973 | 65,130,061 | 73,777,420 |
| Derivative financial liabilities | 13,445,927 | 4,388,511 | 8,640,775 | 2,609,946 | 4,350,184 | 3,017,891 | 2,880,667 | 2,092,198 |
| Securities sold under repurchase agreements | 168,582,810 | 96,267,906 | 215,162,077 | 114,066,400 | 129,837,305 | 133,030,525 | 97,726,435 | 151,911,842 |
| Financial liabilities at amortised cost – Due to depositors | 1,660,680,484 | 1,321,759,956 | 1,696,848,972 | 1,378,167,491 | 1,792,802,024 | 1,420,186,722 | 1,914,359,494 | 1,443,093,453 |
| Financial liabilities at amortised cost – Other borrowings | 32,042,811 | 52,098,343 | 30,611,911 | 50,377,494 | 20,905,990 | 46,167,470 | 16,150,356 | 32,587,051 |
| Current tax liabilities | 13,482,706 | 7,381,495 | 17,505,583 | 8,532,714 | 19,124,762 | 8,508,147 | 24,475,319 | 9,294,180 |
| Deferred tax liabilities | – | – | – | – | – | – | – | – |
| Other liabilities | 52,002,171 | 39,067,270 | 57,008,590 | 46,172,569 | 41,461,508 | 31,794,069 | 39,860,573 | 33,210,883 |
| Due to subsidiaries | 86,493 | 96,676 | 115,191 | 98,567 | 96,295 | 80,785 | 115,484 | 48,699 |
| Subordinated liabilities | 45,117,068 | 34,239,946 | 50,868,395 | 34,704,218 | 50,935,604 | 43,363,999 | 61,400,967 | 38,303,466 |
| Total liabilities | 2,064,338,870 | 1,634,683,157 | 2,141,404,525 | 1,737,203,661 | 2,124,640,425 | 1,766,512,581 | 2,222,099,356 | 1,784,319,192 |
| Equity | ||||||||
| Stated capital | 58,149,621 | 54,564,038 | 58,149,621 | 54,565,350 | 58,149,621 | 54,565,494 | 58,149,621 | 54,566,957 |
| Statutory reserves | 10,204,368 | 9,024,065 | 10,204,368 | 9,024,065 | 10,204,368 | 9,024,065 | 11,352,858 | 10,204,368 |
| Retained earnings | 11,626,483 | 6,637,622 | 3,647,706 | 12,200,306 | 9,504,182 | 18,916,233 | 5,592,121 | 9,028,265 |
| Other reserves | 89,035,877 | 89,293,525 | 120,904,320 | 89,894,437 | 117,563,761 | 81,099,499 | 128,604,076 | 91,094,389 |
| Total equity attributable to equity holders of the Group/Bank | 169,016,349 | 159,519,250 | 192,906,015 | 165,684,158 | 195,421,932 | 163,605,291 | 203,698,676 | 164,893,979 |
| Non-controlling Interest | – | – | – | – | – | – | – | – |
| Total equity | 169,016,349 | 159,519,250 | 192,906,015 | 165,684,158 | 195,421,932 | 163,605,291 | 203,698,676 | 164,893,979 |
| Total liabilities and equity | 2,233,355,219 | 1,794,202,407 | 2,334,310,540 | 1,902,887,819 | 2,320,062,357 | 1,930,117,872 | 2,425,798,032 | 1,949,213,171 |
| Contingent liabilities and commitments | 857,057,146 | 798,522,243 | 719,729,198 | 740,650,015 | 596,546,623 | 672,716,776 | 549,421,699 | 682,399,783 |
| Net assets value per ordinary share (Rs.) | 136.33 | 133.58 | 155.60 | 138.74 | 157.63 | 137.00 | 164.30 | 138.08 |
| Quarterly growth (%) | ||||||||
| Financial assets at amortised cost – Loans and advances to banks & loans and advances to other customers | 12.29 | 2.14 | 5.12 | 4.51 | –5.14 | 2.87 | –0.50 | 3.02 |
| Financial liabilities at amortised cost – Due to depositors | 15.08 | 4.41 | 2.18 | 4.27 | 5.65 | 3.05 | 6.78 | 1.61 |
| Total assets | 14.58 | 3.34 | 4.52 | 6.06 | –0.61 | 1.43 | 4.56 | 0.99 |
Decade at a Glance
| SLFRSs | SLFRSs | LKASs | ||||||||||
| As at December 31, Rs. Mn. | CAGR % | 2022 | 2021 | 2020 | 2019 | 2018 | 2017 | 2016 | 2015 | 2014 | 2013 | |
| Assets | ||||||||||||
| Cash and cash equivalents | 149,394 | 68,078 | 50,251 | 52,535 | 39,534 | 33,225 | 30,194 | 20,044 | 20,592 | 14,262 | ||
| Balances with Central Banks | 66,493 | 52,898 | 110,971 | 39,461 | 54,385 | 44,801 | 43,873 | 28,221 | 19,634 | 18,432 | ||
| Placements with banks | 95,900 | 11,585 | 15,939 | 24,527 | 19,899 | 17,633 | 11,718 | 17,194 | 14,508 | 4,132 | ||
| Securities purchased under resale agreements | 1,517 | 3,000 | – | 13,148 | 9,514 | – | – | 8,002 | 41,198 | 8,946 | ||
| Derivative financial assets | 8,345 | 3,245 | 2,637 | 1,831 | 7,910 | 2,335 | 1,053 | 4,118 | 460 | 838 | ||
| Other financial instruments – Held for trading | – | – | – | – | – | 4,411 | 4,988 | 7,656 | 6,327 | 6,379 | ||
| Financial assets recognised through profit or loss – Measured at fair value | 24,873 | 23,436 | 35,189 | 21,468 | 5,520 | – | – | – | – | – | ||
| Loans and receivables to banks | 12.84 | _Edited-web-resources/image/65.png) |
– | – | – | – | – | 641 | 624 | 601 | 551 | 546 |
| Financial assets at amortised cost – Loans and advances to banks | – | – | 780 | 758 | 763 | – | – | – | – | – | ||
| Loans and receivables to other customers | – | – | – | – | – | 737,447 | 616,018 | 508,115 | 405,431 | 353,062 | ||
| Financial assets at amortised cost – Loans and advances to other customers | 1,130,443 | 1,014,619 | 896,845 | 884,646 | 861,100 | – | – | – | – | – | ||
| Financial investments – Held to maturity | – | – | – | – | – | 63,563 | 60,981 | – | – | – | ||
| Financial investments – Loans and receivables | – | – | – | – | – | 48,712 | 51,824 | 57,724 | 50,436 | 48,943 | ||
| Financial assets at amortised cost – Debt and other financial instruments | 725,935 | 369,418 | 292,728 | 101,145 | 83,855 | – | – | – | – | – | ||
| Financial investments – Available for sale | – | – | – | – | – | 154,714 | 160,023 | 204,244 | 214,208 | 131,757 | ||
| Financial assets measured at fair value through other comprehensive income | 117,056 | 335,463 | 278,461 | 197,568 | 176,507 | – | – | – | – | – | ||
| Total financial assets | 2,319,956 | 1,881,742 | 1,683,801 | 1,337,087 | 1,258,987 | 1,107,482 | 981,296 | 855,919 | 773,345 | 587,297 | ||
| Investments in subsidiaries | 5,808 | 5,808 | 5,808 | 5,011 | 4,264 | 3,066 | 2,435 | 1,237 | 1,211 | 289 | ||
| Investment in associate | 44 | 44 | 44 | 44 | 44 | 44 | 44 | 44 | 44 | 44 | ||
| Property, plant & equipment and right-of-use assets | 25,425 | 23,075 | 23,212 | 20,507 | 15,301 | 14,635 | 10,308 | 9,969 | 9,953 | 8,387 | ||
| Intangible assets | 3,563 | 1,725 | 1,233 | 1,080 | 906 | 777 | 641 | 466 | 439 | 468 | ||
| Leasehold property | – | – | – | – | 72 | 73 | 74 | 74 | 75 | 76 | ||
| Deferred tax assets | 30,301 | 9,793 | 2,500 | 294 | – | – | 964 | – | – | – | ||
| Other assets | 40,699 | 27,024 | 19,620 | 23,323 | 23,911 | 17,297 | 16,439 | 12,096 | 10,543 | 9,426 | ||
| Total assets | 16.84 | 2,425,798 | 1,949,213 | 1,736,218 | 1,387,346 | 1,303,485 | 1,143,374 | 1,012,201 | 879,805 | 795,610 | 605,987 | |
| Liabilities | ||||||||||||
| Due to banks | 65,130 | 73,777 | 87,451 | 51,506 | 50,101 | 57,121 | 67,609 | 30,319 | 25,261 | 14,194 | ||
| Derivative financial liabilities | 2,881 | 2,092 | 1,501 | 1,495 | 8,022 | 3,678 | 1,515 | 1,891 | 1,193 | 1,412 | ||
| Securities sold under repurchase agreements | 97,726 | 151,912 | 91,438 | 51,220 | 49,104 | 49,677 | 69,867 | 112,385 | 124,564 | 45,519 | ||
| Due to other customers/deposits from customers | 17.23 | _Edited-web-resources/image/66.png) |
– | – | – | – | – | 850,128 | 739,563 | 624,102 | 529,361 | 451,153 |
| Financial liabilities at amortised cost – Due to depositors | 1,914,359 | 1,443,093 | 1,265,966 | 1,053,308 | 983,037 | – | – | – | – | – | ||
| Other borrowings | – | – | – | – | – | 23,786 | 9,270 | 9,986 | 11,637 | 8,654 | ||
| Financial liabilities at amortised cost – Other borrowings | 16,150 | 32,587 | 54,556 | 23,249 | 25,362 | – | – | – | – | – | ||
| Current tax liabilities | 24,475 | 9,294 | 6,778 | 4,968 | 6,566 | 4,144 | 3,441 | 3,002 | 1,998 | 1,759 | ||
| Deferred tax liabilities | – | – | – | – | 646 | 3,275 | – | 231 | 2,574 | 1,563 | ||
| Other provisions | – | – | – | – | – | – | 2 | 2 | 2 | 2 | ||
| Other liabilities | 39,861 | 33,211 | 33,038 | 30,497 | 24,208 | 19,225 | 17,710 | 15,547 | 17,444 | 9,827 | ||
| Due to subsidiaries | 115 | 49 | 97 | 54 | 41 | 75 | 20 | 26 | 19 | 16 | ||
| Subordinated liabilities | 61,401 | 38,303 | 38,247 | 37,887 | 37,992 | 25,166 | 24,850 | 11,973 | 11,045 | 10,944 | ||
| Total liabilities | 2,222,099 | 1,784,319 | 1,579,072 | 1,254,184 | 1,185,079 | 1,036,275 | 933,847 | 809,464 | 725,098 | 545,043 | ||
| Equity | ||||||||||||
| Stated capital | 58,150 | 54,567 | 52,188 | 40,917 | 39,148 | 37,144 | 24,978 | 23,255 | 21,458 | 19,587 | ||
| Statutory reserves | 11,353 | 10,204 | 9,024 | 8,205 | 7,354 | 6,477 | 5,648 | 4,922 | 4,327 | 4,035 | ||
| Retained earnings | 5,592 | 9,028 | 7,596 | 5,144 | 5,063 | 4,987 | 4,464 | 4,389 | 4,258 | 4,233 | ||
| Other reserves | 128,604 | 91,094 | 88,338 | 78,896 | 66,841 | 58,491 | 43,264 | 37,775 | 40,469 | 33,089 | ||
| Total liabilities and equity | 16.84 | 2,425,798 | 1,949,213 | 1,736,218 | 1,387,346 | 1,303,485 | 1,143,374 | 1,012,201 | 879,805 | 795,610 | 605,987 | |
| Contingent liabilities and commitments | 549,422 | 682,400 | 728,712 | 579,999 | 658,722 | 564,795 | 498,305 | 521,232 | 352,453 | 295,452 | ||
| SLFRSs | SLFRSs | LKASs | ||||||||||
| For the year ended December 31, Rs. Mn. | CAGR % | 2022 | 2021 | 2020 | 2019 | 2018 | 2017 | 2016 | 2015 | 2014 | 2013 | |
| Operating results | ||||||||||||
| Gross income | 15.82 | 275,444 | 160,886 | 149,711 | 148,706 | 138,049 | 114,357 | 93,143 | 77,868 | 72,753 | 73,736 | |
| Interest income | 218,327 | 130,443 | 122,330 | 127,780 | 117,466 | 103,034 | 80,738 | 66,030 | 61,832 | 62,764 | ||
| Interest expense | (136,583) | (65,832) | (72,759) | (80,571) | (72,524) | (64,011) | (47,915) | (35,685) | (34,610) | (36,879) | ||
| Foreign exchange profit | 31,120 | 10,589 | 8,338 | 6,726 | 7,900 | 588 | 2,326 | 2,877 | 1,481 | 1,996 | ||
| Net Commission and other income | 20,024 | 16,195 | 17,031 | 12,082 | 10,845 | 9,169 | 8,951 | 8,059 | 8,677 | 8,349 | ||
| Operating expenses, impairment and taxes on financial services | (110,290) | (59,394) | (51,429) | (43,678) | (38,096) | (25,597) | (24,049) | (24,138) | (21,644) | (21,720) | ||
| Profit before tax | 4.69 | 22,598 | 32,001 | 23,511 | 22,339 | 25,591 | 23,183 | 20,051 | 17,143 | 15,736 | 14,510 | |
| Income tax expense | 372 | (8,395) | (7,138) | (5,314) | (8,047) | (6,602) | (5,539) | (5,240) | (4,556) | (4,065) | ||
| Profit for the year | 8.57 | 22,970 | 23,606 | 16,373 | 17,025 | 17,544 | 16,581 | 14,512 | 11,903 | 11,180 | 10,445 | |
| Ratios | ||||||||||||
| Return on average-shareholders’ funds (%) | 12.46 | 14.66 | 11.28 | 13.54 | 15.56 | 17.88 | 19.52 | 16.90 | 17.01 | 18.40 | ||
| Income growth (%) | 71.20 | 7.46 | 0.68 | 7.72 | 20.72 | 24.10 | 19.62 | 7.03 | 0.96 | 16.31 | ||
| Return on average assets (%) | 1.05 | 1.28 | 1.05 | 1.27 | 1.43 | 1.54 | 1.53 | 1.42 | 1.60 | 1.87 | ||
| Ordinary share dividend cover (times) | 4.12 | 2.64 | 2.34 | 2.55 | 2.67 | 2.62 | 2.25 | 2.09 | 1.99 | 1.89 | ||
| Advances to deposits and refinance (%) | 63.30 | 73.54 | 72.96 | 86.74 | 86.96 | 86.07 | 82.69 | 80.84 | 75.89 | 77.48 | ||
| Property, plant and equipment and intangible assets to shareholders’ funds (%) | 14.23 | 15.04 | 15.56 | 16.21 | 13.75 | 14.46 | 14.07 | 14.94 | 14.85 | 14.65 | ||
| Total assets to shareholders’ funds (times) | 11.91 | 11.82 | 11.05 | 10.42 | 11.01 | 10.68 | 12.92 | 12.51 | 11.28 | 9.94 | ||
| Capital funds to liabilities including contingent liabilities (%) | 7.35 | 6.68 | 6.81 | 7.26 | 6.42 | 6.69 | 5.47 | 5.29 | 6.54 | 7.25 | ||
| Cost/income ratio (%) | 29.22 | 37.97 | 39.96 | 49.41 | 46.35 | 51.08 | 51.06 | 48.92 | 49.26 | 45.59 | ||
| Liquid assets ratio – Domestic Banking Unit (DBU) (%) | 35.01 | 38.73 | 44.99 | 30.42 | 24.47 | 27.28 | 27.19 | 26.24 | 33.15 | 33.66 | ||
| Liquid assets ratio – Offshore Banking Centre (OBC) (%) | 32.37 | 36.39 | 32.70 | 25.25 | 30.20 | 30.95 | 30.19 | 49.13 | 31.43 | 29.38 | ||
| (As specified in the Banking Act No. 30 of 1988) | ||||||||||||
| Group capital adequacy (%) (under Basel II) Tier I | N/A | N/A | N/A | N/A | N/A | N/A | 11.59 | 11.55 | 13.07 | 13.30 | ||
| Tier I & II | N/A | N/A | N/A | N/A | N/A | N/A | 16.01 | 14.28 | 16.22 | 16.93 | ||
| Group capital adequacy (%) (under Basel III) | ||||||||||||
| Common equity Tier I capital ratio | 11.34 | 12.05 | 13.36 | 12.40 | 11.43 | 12.12 | – | – | – | – | ||
| Tier I capital ratio | 11.34 | 12.05 | 13.36 | 12.40 | 11.43 | 12.12 | – | – | – | – | ||
| Total capital ratio | 14.51 | 15.70 | 16.88 | 16.18 | 15.62 | 15.70 | – | – | – | – | ||
| Share information | ||||||||||||
| Market value of a voting ordinary share (Rs.) | 50.20 | 79.30 | 80.90 | 95.00 | 115.00 | 135.80 | 145.00 | 140.20 | 171.00 | 120.40 | ||
| Earnings per share (Rs.) | 19 | 19 | 15 | 17 | 17 | 17 | 16 | 13 | 13 | 12 | ||
| Dividend per share (Rs.) | 4.50 | 7.50 | 6.50 | 6.50 | 6.50 | 6.50 | 6.50 | 6.50 | 6.50 | 6.50 | ||
| Price earnings ratio (times) | 3 | 4 | 5 | 5 | 7 | 8 | 9 | 10 | 13 | 10 | ||
| Net assets value per share (Rs.) | 164 | 138 | 135 | 130 | 117 | 108 | 88 | 80 | 81 | 72 | ||
| Earnings yield (%) | 37 | 24 | 19 | 17 | 15 | 13 | 11 | 10 | 8 | 10 | ||
| Gross dividends (Rs. Bn.) to ordinary shareholders | 5.58 | 8.96 | 7.59 | 6.68 | 6.57 | 6.48 | 5.77 | 5.70 | 5.70 | 5.52 | ||
| Dividend payout ratio (%) – Cash | – | 22 | 32 | 27 | 26 | 26 | 28 | 33 | 35 | 37 | ||
| Total dividend payout ratio (%) | 24 | 38 | 46 | 39 | 37 | 38 | 40 | 48 | 50 | 53 | ||
| Other information | ||||||||||||
| Number of employees | 5,121 | 5,072 | 5,057 | 5,062 | 5,027 | 4,982 | 4,987 | 4,951 | 4,852 | 4,730 | ||
| Number of delivery points – Sri Lanka | 1.71 | |
269 | 268 | 268 | 268 | 266 | 261 | 255 | 246 | 239 | 235 |
| Number of delivery points – Bangladesh | 20 | 19 | 19 | 19 | 19 | 19 | 19 | 18 | 18 | 18 | ||
| Number of automated teller machines | 5.03 | 934 | 921 | 906 | 885 | 850 | 775 | 677 | 640 | 625 | 604 | |
CAGR – Compounded Annual Growth Rate
Group Structure
Local Subsidiaries |
Local Associate |
Foreign Subsidiaries |
|||||
| Commercial Development Company PLC |
CBC Tech Solutions Ltd. | CBC Finance Limited | Commercial Insurance Brokers (Pvt) Ltd. |
Equity Investments Lanka Limited |
Commercial Bank of Maldives Private Limited | CBC Myanmar Microfinance Company Limited | |
 |
 |
 |
 |
||||
| Incorporated on | March 14, 1980 in Sri Lanka |
February 17, 2003 in Sri Lanka |
February 18, 1987 in Sri Lanka | August 17, 1987 in Sri Lanka |
August 8, 1990 in Sri Lanka |
March 24, 2015 in Maldives |
April 4, 2017 in Myanmar |
| Bank’s Holding |  90.00% 90.00% |
 100% 100% |
100% |
 60.00% 60.00% |
 22.92% 22.92% |
 55% 55% |
100% |
| Principal Business Activities | Property development and provision of other utility services |
Providing Information & Communication Technology (ICT) related products, services and solutions to corporate sector | Granting of leasing & hire purchase facilities, mortgage loans and other loan facilities. Accepting public deposits | Insurance Brokering | Venture Capital Financing | Banking | Microfinancing |
| Business Address | 4th Floor, No. 8-4/2, York Arcade Building, Leyden Bastian Road, Colombo 01. | “Commercial House”, No. 21, Sir Razik Fareed Mawatha, Colombo 01. | No. 187, Katugastota Road, Kandy. | No. 347, Dr Colvin R De Silva Mawatha, Colombo 02. | No. 108 A, 2/1, Maya Avenue, Colombo 06. | H. Filigasdhoshuge, Ameer Ahmed Magu, K. Male 20066, Maldives. |
No. 15, Office Street, Ward 4, Lewe Township, Nay Pyi Taw, Myanmar. |
| Contact Numbers | +94 11 244 7300 | +94 11 257 4417 +94 11 257 4407 | +94 81 221 3498 +94 81 220 0272 | +94 11 760 0600 | +94 11 250 7605 +94 11 537 3745 +94 11 537 3746 | +96 0333 2668 | +95 67 80 30566 |
| Board of Directors | |||||||
| Chairman | B R L Fernando | Prof A K W Jayawardane |
K G D D Dheerasinghe |
M P Jayawardena | M J C Amarasuriya | Ahmed Nazeer |
K G D D Dheerasinghe |
| Managing Director/ Chief Executive Officer |
S C U Manatunge | P K A S K Gunawardhana |
D M U N Dissanayake |
T D Thomas | Deshamanya S E Captain |
D D J Rajapakse |
D K S S Piyaratne |
| Chief Executive Officer | R N De Silva (*) | K Mediwake (*) |
|||||
| Director | A L Gooneratne | K D N Buddhipala |
S Muhseen | D M D K Thilakaratne | J D Peiris | S C U Manatunge |
D J D P Hettiarachchi |
| Director | A T P Edirisinghe | K S A Gamage |
Dr (Ms) J P Kuruppu | U I S Tillakawardana | J B Abu Baker | S Prabagar |
G Sivasubramaniam |
| Director | L D A Jayasinghe | S M S C Jayasuriya | D J D P Hettiarachchi | W I Arambage | U I S Tillakawardana |
S Prabagar | |
| Director | U I S Tillakawardena | D M D S S Bandara | W M N S K Weerapana | K C Vignarajah | Dr Ibrahim Vishan |
||
| Director | L H Munasinghe | L W P Indrajith | M H Wijewaradene | Ms Fareeha Shareef |
|||
| Director | M P Dharmasiri | Ms Aishath Zahira |
|||||
| Director | J A D J C Nanayakkara |
||||||
| Company Secretary | L W P Indrajith | M P Dharmasiri | Ms H D U O Gunasekara | Ms Y A Kularathna | Mrs R R Dunuwille | Ms Aminath Nashadil |
D K S S Piyaratne |
(*) Not a Board Member
Summary of financial information
| 2022 | 2021 | 2022 | 2021 | 2022 | 2021 | 2022 | 2021 | 2022 | 2021 | 2022 | 2021 | 2022 | 2021 | |
| Rs. Mn. | Rs. Mn. | Rs. Mn. | Rs. Mn. | Rs. Mn. | Rs. Mn. | Rs. Mn. | Rs. Mn. | Rs. Mn. | Rs. Mn. | Rs. Mn. | Rs. Mn. | Rs. Mn. | Rs. Mn. | |
| Total assets | 4,055.082 | 3,785.349 | 626.869 | 461.022 | 10,955.136 | 10,311.545 | 758.701 | 722.908 | 254.460 | 374.086 | 69,661.744 | 30,042.751 | 602.206 | 394.538 |
| Total liabilities | 637.659 | 457.986 | 82.845 | 58.643 | 7,777.664 | 7,058.035 | 191.540 | 147.146 | 28.180 | 125.262 | 61,350.362 | 26,258.969 | 182.927 | 33.976 |
| Net assets | 3,417.423 | 3,327.363 | 544.024 | 402.379 | 3,177.472 | 3,253.510 | 567.161 | 575.762 | 226.280 | 248.824 | 8,311.383 | 3,783.782 | 419.279 | 360.562 |
| Total revenue | 631.128 | 632.287 | 647.407 | 354.303 | 1,636.161 | 1,264.114 | 139.075 | 204.239 | 24.697 | 41.059 | 3,408.935 | 1,529.550 | 92.660 | 52.965 |
| Profit before tax | 401.289 | 427.265 | 186.761 | 156.761 | 9.726 | 141.384 | 43.809 | 35.784 | (16.263) | 8.272 | 1,612.825 | 568.352 | (138.585) | (37.807) |
| Profit after tax | 224.377 | 401.506 | 171.724 | 181.134 | 39.583 | 51.612 | 31.349 | 30.286 | (16.263) | 8.272 | 1,232.231 | 426.986 | (137.619) | (30.370) |
| Dividend per share (Rs.) | 7.00 | 6.50 | 50.00 | 50.00 | – | – | 25.00 | 33.33 | – | 1.00 | – | – | – | – |