Management Discussion and Analysis
Investor Relations
Dear Stakeholder,
We would like to express our sincere gratitude to our loyal investors for choosing to invest in the capital of the Bank, both equity and debt, and assure you that we are constantly working to optimise returns on your investments through prudent and sustainable growth and value creation. We recognise that it is our duty to provide you with timely, relevant, and balanced view of the Bank’s fundamentals in terms of operational results, financial position, and cash flows so that you can make wise and well-informed decisions. We are one of the four Domestic Systemically Important Banks (D-SIBs) and the only private sector bank in Sri Lanka designated by the Central Bank of Sri Lanka as a higher-tier D-SIB and also as the largest private sector Bank in the country. In this regard, we are confident that we were able to meet the expectations of our valued investors despite the unprecedented operating environment and the unfavourable macro-economic conditions that defined the year 2022. We would like to pledge to uphold our commitment to fulfilling our obligations in the future in the best interests of our investors. We are confident that the information provided in this Integrated Annual Report will help investors to better understand the Bank’s core competencies, boost trust, and foster loyalty, bringing together a loyal group of investors who takes a long term view of sustainable value creation for their investment.
The Bank continuously aims to foster effective two-way communication with our valued investors, promoting mutual trust and confidence, while ensuring the rights conferred on the investors by various statutes to address the material matters as identified therein, as further explained in the section on “Connecting with stakeholders” , We believe that these initiatives have given the Bank the opportunity to actively engage with our investors in a consistent, extensive and effective manner, often going beyond the legal requirements and in the underlying spirit, promoting its reputation.
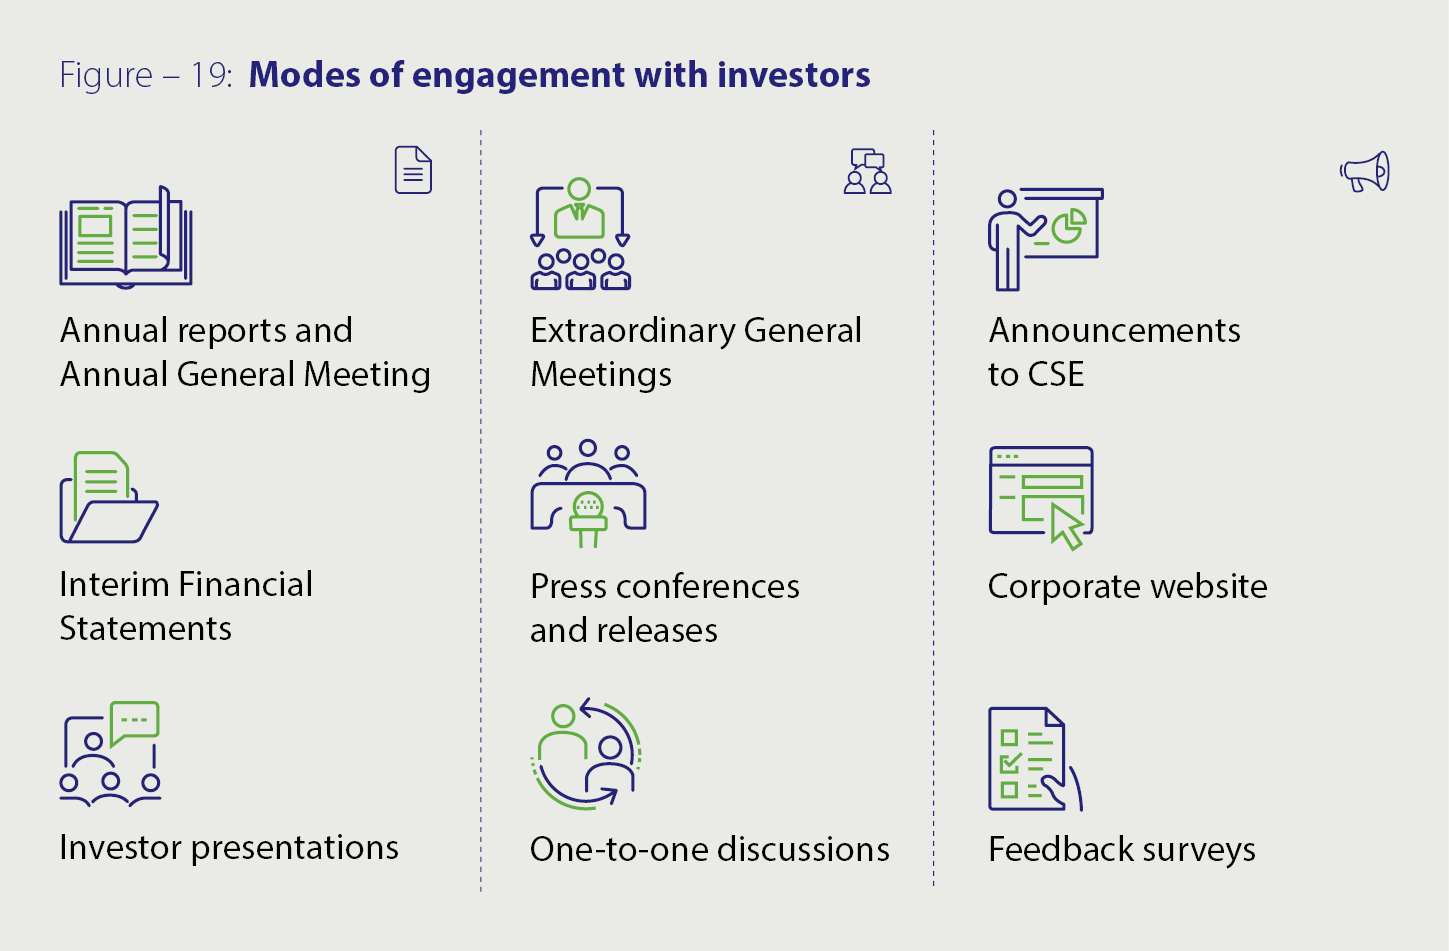
The Bank deploys a multi-faceted approach to engage and interact with its stakeholders. This includes the Annual Report, which serves as the Bank’s primary investor communications tool as well as the Annual General Meetings and Extra-Ordinary General Meetings, which are called as needed giving the investor community opportunities to engage and interact with the Bank. As in the past, the Bank took the initiative to produce an integrated Annual Report in a concise manner this year as well, as can be observed across each section of this Report. The insightful feedback provided by our shareholders in response to previous surveys and comments has been carefully taken into account. In order to seek your useful recommendations and opinions for further improvements, we have made arrangements to include a stakeholder feedback form in this year’s Annual Report in order to seek your valuable suggestions and opinion for further improvements. Your feedback is very important to us and we take them very seriously. We make every effort to improve our Annual Report each year by considering your valuable suggestions and incorporating them into our strategies for long-term value creation to all our stakeholders. These engagements, in our opinion, will undoubtedly assist our investors in gaining insights into the Bank’s performance, strategic direction, governance mechanism in place, risk management strategies adopted and the Sustainability Framework.
Financial information relevant to investors can be found in our website; is another popular channel available for stakeholders, where both a PDF and an interactive version of the Bank’s Annual Report have been hosted. The Bank makes sure that its pages are regularly updated along with the rest of the site’s content.
We are confident that despite the unprecedented economic and operating environment that persisted throughout the year due to a multitude of global and local developments detailed in Our Operating Context and Outlook, the Bank’s efforts to have effective communication and active engagement with significant stakeholder groups have made the Bank's shares an attractive investment proposition.
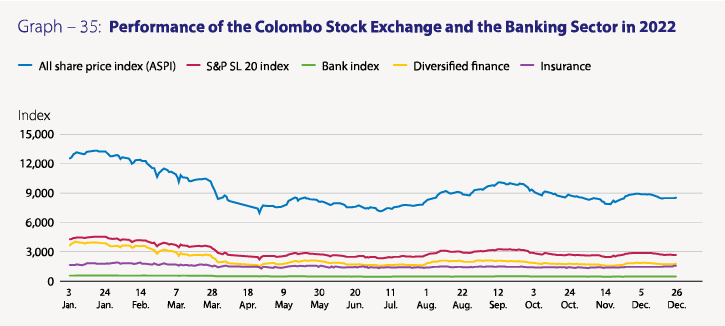
Performance of the Colombo Stock Exchange (CSE) in 2022
Contrary to the year 2021, a record-breaking year for the CSE, 2022 saw a notable decline in the performance of the CSE during most part of the year. The decline was primarily due to effect of COVID-19, followed by the social unrest and the unstable political environment. Consequently, the benchmark All Share Price Index (ASPI) dropped to 8,490 points by the end of 2022 from 12,226 points recorded at the end of 2021, recording a drop of 3,736 points or 30.56%. The S&P SL20 index followed the ASPI and dropped to 2,636 points by the end of 2022, from 4,232 points at the end of 2021, recording a drop of 1,596 points or 37.72%. The market capitalisation also recorded a sharp drop, falling from Rs. 5.490 Tn. at the end of 2021 to Rs. 3.847 Tn. at the end of 2022, a drop of 29.93%.
Performance of the Banking Sector and Commercial Bank shares in 2022
Given the adverse performance of the ASPI and the S&P SL20 indices during 2022, as shown in the above graph, the banking sector shares too displayed subpar performance primarily because of the perceived sector-specific uncertainties, which directly affected the performance of banks. They included many relief programs offered to both affected individuals and corporate customers including the extension of moratoriums by the regulator, lack of appetite for lending by banks for obvious reasons, restrictions imposed on the payment of cash dividends by the regulator, the Government decision to increase VAT on Financial Services to 18% from 15% effective from January 2022, Corporate Income Tax rates effective from July 2022 and the introduction of Social Security Contribution Levy of 2.5% effective from October 2022. These factors contributed to the drop in the share price of the Bank’s ordinary voting shares, which traded at a discount to its book value at 0.31 times at the end of 2022 (0.57 times at the end of 2021). However, it continued to remain the highest among the peers in the banking sector. Following the trend recorded in the ASPI and the S&P SL20 indices, the Bank index too dropped by 36.68% in 2022 and stood at 386 points at the end of 2022 compared to 609 points at the end 2021.
As at December 31, 2022, the Bank’s public holding (free float) was 99.81% in voting shares (up from 99.77% in 2021) and 99.88% in non-voting shares (up from 99.86% in 2021), while its float-adjusted market capitalisation (compliant under option-1 of the Rules on minimum public holding requirement of the CSE) was Rs. 61.476 Bn. (down from Rs. 93.981 Bn. in 2021). As shown in Tables 34 and 35, investors are given a convenient “enter and exit” mechanism even though the number of share transactions and the number of shares traded in the CSE recorded a notable decline. It is important to note that despite the difficult circumstances encountered in 2022, the number of shareholders holding both voting and non-voting shares of the Bank during the year stayed roughly at the same levels as depicted in Table 37 This shows the confidence placed by investors in the Bank’s shares.
Compliance report on the contents of the Annual Report in terms of the Listing Rules of the CSE
We are pleased to inform you that the Bank has fully complied with all relevant provisions of Section 7.6 of the Listing Rules of the CSE regarding the information to be included in an entity’s Annual Report and financial statements.
Table 27 given below provides a complete list of disclosure requirements and references to the relevant sections of this Annual Report where the Bank’s compliance with the required disclosures are made together with the relevant page numbers.
The pages that follow contain information on the performance of the Bank’s listed securities.
Table – 27: Compliance with requirements of the Section 7.6 of the Listing Rules of the CSE
| Rule No. | Disclosure requirement | Section/Reference | |
| 7.6 (i) | Names of persons who during the financial year were Directors of the Bank | Governance and Risk Management | |
| 7.6 (ii) | Principal activities of the Bank and its subsidiaries during the year and any changes therein | Note 1.3 to the Financial Statements Group Structure | |
| 7.6 (iii) | The names and the number of shares held by the 20 largest holders of voting and non-voting shares and the percentage of such shares held | Item 4.2 of the “Investor Relations” | |
| 7.6 (iv) | The float adjusted market capitalisation, public holding percentage (%), number of public shareholders and under which option the Bank complies with the minimum public holding requirement, in respect of voting ordinary shares. The public holding percentage (%) in respect of non-voting ordinary shares. | Item 4.3 of the “Investor Relations” | |
| 7.6 (v) | A statement of each Directors’ holding and Chief Executive Officer’s holding in shares of the Bank at the beginning and end of the financial year | Item 4.4 of the “Investor Relations” | |
| 7.6 (vi) | Information pertaining to material foreseeable risk factors of the Bank | Item 5 of the “Investor Relations” | |
| 7.6 (vii) | Details of material issues pertaining to employees and industrial relations of the Bank | Item 6 of the “Investor Relations” | |
| 7.6 (viii) | Extents, locations, valuations, and the number of buildings of the Bank’s land holdings and investment properties | Note 38.5 (a) and (b) to the Financial Statements | |
| 7.6 (ix) | Number of shares representing the Bank’s stated capital | Note 51 to the Financial Statements Item 7 of the “Investor Relations” |
|
| 7.6 (x) | A distribution schedule of the number of holders in each class of equity securities, and the percentage of their total holdings as at the end of the year | Item 4.5 of the “Investor Relations” | |
| 7.6 (xi) | Ratios and market price information: Equity – Dividend per share, dividend payout ratio, net asset value per share, market value per share – highest and lowest values recorded during the financial year and the market value as at the end of financial year – Highest price, lowest price, last traded price Debt – Interest rate of comparable Government Securities, debt/equity ratio, interest cover and quick asset ratio, market prices and yield during the year Any changes in credit rating (for the Bank or any other instrument issued by the Bank) | Financial Highlights Items 2, 3 and 11 of the “Investor Relations” Items 10 and 11 of the “Investor Relations” Item 12 of the “Investor Relations” |
|
| 7.6 (xii) | Significant changes in the Bank’s or its subsidiaries’ fixed assets and the market value of land, if the value differs substantially from the book value | Note 38.5 (b) to the Financial Statements | |
| 7.6 (xiii) | Details of funds raised through an Initial Public Offering and/or a further issue of securities during the year a. the manner in which the funds of such issue/s have been utilised in conformity with the format provided by the Exchange from time to time; b. if any shares or debentures have been issued, the number, class and consideration received and the reason for the issue; and, c. any material change in the use of funds raised through an issue of Securities. In the event the funds raised through the Initial Public Offering and/or the further issue of securities (as applicable) have been fully utilised by the Bank as disclosed in the Prospectus and/or Circular to shareholders between two financial periods, the entity shall disclose such fact in the immediate succeeding Annual Report or the interim financial statement, whichever is published first. | Note 51 and 51.1 to the Financial Statements The Bank did not raise funds through a share issue during the year. Note 50 to the Financial Statements for the details of debentures issued during the year. Item 10 of the “Investor Relations” | |
| 7.6 (xiv) | a. Information in respect of Employee Share Option Schemes (ESOS) – The number of options granted to each category of employees during the financial year. – Total number of options vested but not exercised by each category of employees during the financial year. – Total number of options exercised by each category of employees and the total number of shares arising therefrom during the financial year. – Options cancelled during the financial year and the reasons for such cancellation. – The exercise price. | _Edited-web-resources/image/75.png) |
Note 52.1 to the Financial Statements |
| – A declaration by the Directors of the Bank confirming that the Bank or any of its subsidiaries has not, directly or indirectly, provided funds for the ESOS. | Item 24 of the Statement of Compliance | ||
| b. Information in respect of Employee Share Purchase Schemes (ESPS) – The total number of shares issued under the ESPS during the financial year – The number of shares issued to each category of employees during the financial year – The price at which the shares were issued to the employees – A declaration by the Directors of the Bank confirming that the Bank or any of its subsidiaries has not, directly or indirectly, provided funds for the ESPS | _Edited-web-resources/image/76.png) |
Not applicable as the Bank does not have Employee Share Purchase Schemes |
|
| 7.6 (xv) | Disclosures pertaining to corporate governance practices in terms of Rules 7.10.3, 7.10.5 (c) and 7.10.6 (c) of Section 7 of the Rules. | Not applicable since the Bank received an exemption in terms of Section 7.10 (c) of the Listing Rules | |
| 7.6 (xvi) | Related party transactions exceeding 10% of the equity or 5% of the total assets of the Bank as per Audited Financial Statements, whichever is lower | The Bank did not have any related party transactions exceeding this threshold during the year 2022 and as at end 2022 (Note 62.6 to the Financial Statements) | |
| Details of investments in a related party and/or amounts due from a related party to be set out separately The details shall include, as a minimum: i. The date of the transaction; ii. The name of the related party; iii. The relationship between the Bank and the related party; iv. The amount of the transaction and terms of the transaction; v. The rationale for entering into the transaction. | _Edited-web-resources/image/77.png) |
Item 20.3 of the Statement of Compliance |
1. Listed securities of the Bank
The Bank’s ordinary shares (both voting and non-voting) are listed on the Main Board of the CSE under the ticker symbol “COMB”. All debentures issued are also listed on the CSE. (Refer Table 28 for a summary of listed securities of the Bank).
The Business section of most daily newspapers, including the Daily News, Daily FT, The Island and Daily Mirror carry a summary of trading activity and the daily prices of shares and debentures traded (if any) using the abbreviation of Commercial Bank or COMB.
Table – 28: Summary of listed securities of the Bank
| Number in issue as at | Stock symbol | ||
| December 31, 2022 | December 31, 2021 | ||
| Equity | |||
| Ordinary shares – Voting | 1,167,236,442 | 1,124,480,528 | COMB-N0000 |
| Ordinary shares – Non-voting | 72,541,605 | 69,740,771 | COMB-X0000 |
| Debt | |||
| Fixed rate Debentures March 2016/26 | 17,490,900 | 17,490,900 | COMB-BD-08/03/26-C2342-11.25% |
| Fixed rate Debentures October 2016/26 | 19,282,000 | 19,282,000 | COMB-BD-27/10/26-C2359-12.25% |
| Fixed rate Debentures July 2018/23 | 83,938,400 | 83,938,400 | COMB-BD-22/07/23-C2404-12.00% |
| Fixed rate Debentures July 2018/28 | 16,061,600 | 16,061,600 | COMB-BD-22/07/28-C2405-12.50% |
| Fixed rate Debentures September 2021/26 | 42,374,700 | 42,374,700 | COMB-BD-20/09/26-C2491-09.00% |
| Fixed rate Debentures September 2021/28 | 43,580,000 | 43,580,000 | COMB-BD-20/09/28-C2492-09.50% |
| Fixed rate Debentures December 2022/27 | 67,246,800 | Issued during the year 2022 | COMB-BD-11/12/27-C2504-28.00% |
| Fixed rate Debentures December 2022/29 | 32,638,200 | COMB-BD-11/12/29-C2503-27.00% | |
| Fixed rate Debentures December 2022/32 | 115,000 | COMB-BD-11/12/32-C2505-22.00% | |
Equity securities
Table – 29: Features of ordinary shares
| Security type | Quoted ordinary shares |
| Listed exchange | Colombo Stock Exchange (CSE) – Main Board |
| Featured stock indices | All Share Price Index (ASPI) |
| Standard & Poor’s Sri Lanka 20 (S&P SL20) | |
| GICS Industry Group | Banks |
| CSE stock symbol | Voting – COMB.N0000 |
| Non-voting – COMB.X0000 | |
| International Securities Identification Number (ISIN) | Voting – LK0053N00005 |
| Non-voting – LK0053X00004 |
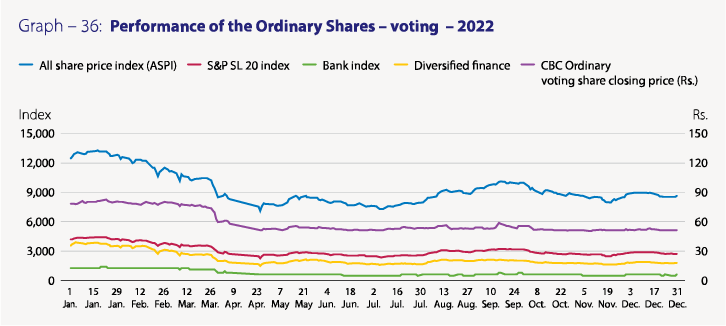
2. Performance of COMB shares and returns to shareholders
Despite the year’s lacklustre market performance, investor interest in the Bank’s shares persisted during the year compared to 2021 as evidenced by the increased number of shareholders in both Voting and Non-Voting Ordinary Shares (Refer table 37).
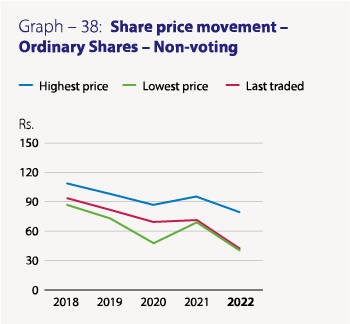
The market price of an ordinary voting share of the Bank decreased by 36.70% (a drop of 1.98% in 2021) from Rs. 79.30 at the end of 2021 to Rs. 50.20 at the end of 2022 (Tables 31 and 32). The Bank continued with its policy of issuing scrip dividends and Employee Share Option Plans. Market capitalisation in terms of rupees for both voting and non-voting shares stood at Rs. 61.6 Bn. (USD 167.824 Mn.) at the end of 2022 compared to Rs. 94.2 Bn. (USD 470.963 Mn.) at the end of 2021, and accounted for 1.6% of the total market capitalisation as at end of 2022 (1.72% in 2021). The Bank’s shares ranked twelfth among all listed entities and first among the listed corporates in the Banking sector. During most of 2022, the movement of the prices of non-voting shares followed the trend of the voting shares.
2.1 Movement of COMB voting share price over the year Table – 30
| Month | Jan., 22 | Feb., 22 | Mar., 22 | Apr., 22 | May, 22 | Jun., 22 | Jul., 22 | Aug., 22 | Sep., 22 | Oct., 22 | Nov., 22 | Dec., 22 |
| Highest price (Rs.) | 85.00 | 83.00 | 83.00 | 64.80 | 56.00 | 54.80 | 58.00 | 56.70 | 59.90 | 55.50 | 52.00 | 52.80 |
| Lowest price (Rs.) | 79.00 | 78.20 | 61.00 | 50.00 | 50.00 | 50.00 | 49.60 | 51.10 | 51.00 | 49.50 | 48.70 | 50.00 |
| Price at the month-end (Rs.) | 82.60 | 81.90 | 62.70 | 51.50 | 53.90 | 50.60 | 52.70 | 51.90 | 55.00 | 50.20 | 51.40 | 50.20 |
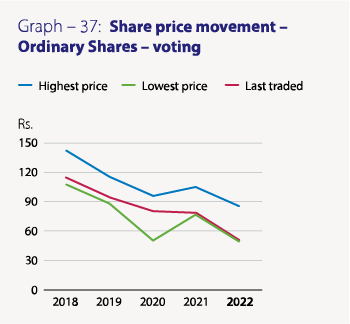
2.2 Share price movement of last five years Table – 31
| 2022 Rs. | 2021 Rs. | 2020 Rs. | 2019 Rs. | 2018 Rs. | |
| Ordinary shares – Voting | |||||
| Highest price during the year | 85.00 | 105.00 | 96.00 | 115.90 | 142.50 |
| Lowest price during the year | 48.70 | 76.90 | 50.00 | 88.60 | 107.50 |
| Last traded price | 50.20 | 79.30 | 80.90 | 95.00 | 115.00 |
| Ordinary shares – Non-voting | |||||
| Highest price during the year | 78.50 | 95.90 | 87.20 | 99.40 | 110.00 |
| Lowest price during the year | 39.40 | 69.60 | 48.00 | 74.00 | 88.00 |
| Last traded price | 41.30 | 72.00 | 70.10 | 83.00 | 95.00 |
2.3 Sustainable value for investors Table – 32
| Ordinary shares – Voting | Ordinary shares – Non-voting | |||||
| Trade date | 2022 | 2021 | Trade date | 2022 | 201 | |
| Rs. | Rs. | Rs. | Rs. | |||
| Highest price | January 24, 2022 | 85.00 | January 24, 2022 | 78.50 | ||
| January, 29 2021 | 105.00 | January, 19 2021 | 95.90 | |||
| Lowest price | November 08, 2022 | 48.70 | August 19, 2022 | 39.40 | ||
| December 23, 2021 | 76.90 | December 22, 2021 | 69.60 | |||
| Year-end price | 50.20 | 79.30 | 41.30 | 72.00 | ||
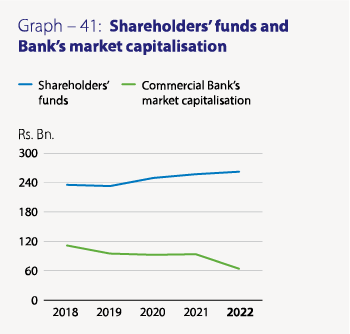
2.4 Information on shareholders’ funds and Bank’s market capitalisation Table – 33
| As at December 31, | Shareholders’ funds | Commercial Bank’s market capitalisation (*) |
Total market capitalisation of the CSE |
Commercial Bank’s market capitalisation as a percentage of CSE market capitalisation |
Commercial Bank’s market capitalisation ranking |
Commercial Bank’s market capitalisation (*) |
| Rs. Bn. | Rs. Bn. | Rs. Bn. | % | Rank | USD Mn. | |
| 2022 | 204 | 62 | 3,847 | 1.60 | 12 | 167.824 |
| 2021 | 165 | 94 | 5,490 | 1.72 | 9 | 470.963 |
| 2020 | 157 | 94 | 2,961 | 3.16 | 5 | 500.902 |
| 2019 | 133 | 97 | 2,851 | 3.40 | 4 | 532.699 |
| 2018 | 118 | 115 | 2,839 | 4.05 | 3 | 628.415 |
(*) Market capitalisation includes both voting and non-voting shares
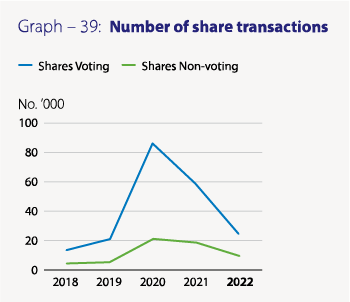
2.5 Number of share transactions (No.) Table – 34
| 2022 | 2021 | 2020 | 2019 | 2018 | |
| Ordinary shares – Voting | 25,271 | 58,754 | 85,914 | 21,481 | 13,364 |
| Ordinary shares – Non-voting | 10,075 | 18,827 | 21,407 | 5,452 | 4,553 |
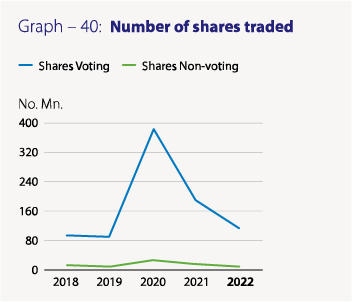
2.6 Number of shares traded (No. ’000) Table – 35
| 2022 | 2021 | 2020 | 2019 | 2018 | |
| Ordinary shares – Voting | 114,432 | 187,853 | 385,017 | 89,289 | 95,286 |
| Ordinary shares – Non-voting | 8,355 | 15,712 | 26,614 | 5,893 | 10,637 |
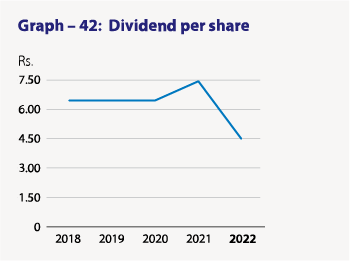
3. Dividends
We wish to reiterate that the Bank is fully aware and understands that a declaration of a dividend is fundamental to maintaining a balance between the shareholders’ expectations and the business needs of the Bank. Although the Bank has been paying interim cash dividends up to 2019, the Bank did not pay any interim cash dividends during the past three years. This was in compliance with the requirements of the Banking Act Direction No. 03 of 2021, dated May 13, 2020, the Direction No. 01 of 2021 dated January 19, 2021, the Direction No. 11 of 2021 dated July 13, 2021 and the Direction No. 02 of 2022 dated May 06, 2022, issued by the CBSL on “Restrictions on Discretionary Payments of Licensed Banks”, wherein licensed banks were instructed to refrain from declaring cash dividends for financial years ended December 31, 2020, 2021 and 2022 in view of the possible adverse impact on liquidity and other key performance indicators of banks. However, as per the Banking Act Direction No. 01 of 2021, dated January 19, 2021, the Direction No. 11 of 2021 dated July 13, 2021 and the Direction No. 02 of 2022 dated May 06, 2022, issued by the CBSL on the same subject, licenced banks incorporated or established in Sri Lanka were instructed to defer payment of cash dividends until the Financial Statements for the year ended December 31, 2020 and 2021 are finalised and audited by the External Auditors.
Accordingly, the Board of Directors of the Bank after giving due consideration to the requirements stipulated in the Banking Act Directions No. 01 of 2023 dated February 02, 2023 has now recommended a final dividend of Rs. 4.50 per ordinary share for both ordinary voting and non-voting shares of the Bank. This will be paid in the form of issue and allotment of new shares for both voting and non-voting shareholders of the Bank for the year ended December 31, 2022. This proposed first and final dividend for the year 2022 will be submitted for the approval of the shareholders at the 54th AGM, to be held on March 30, 2023.
(A dividend of Rs. 7.50 per share was declared and paid by the Bank for the year ended December 31, 2021. It consisted of a cash dividend of Rs. 4.50 per share and balance entitlement of Rs. 3.00 per share was satisfied in the form of an issue and allotment of new shares).
3.1 Dividend information Table – 36
| Dividends | 2022 | 2021 | 2020 | 2019 | 2018 |
| Cash – Rs. per share | |||||
| First interim paid | – | – | – | 1.50 | 1.50 |
| Second interim paid | – | – | – | 3.00 | 3.00 |
| Final proposed | – | 4.50 | 4.50 | – | – |
| Total | – | 4.50 | 4.50 | 4.50 | 4.50 |
| Scrip – Rs. per share | |||||
| Final proposed/allotted | 4.50 | 3.00 | 2.00 | 2.00 | 2.00 |
| Total | 4.50 | 7.50 | 6.50 | 6.50 | 6.50 |
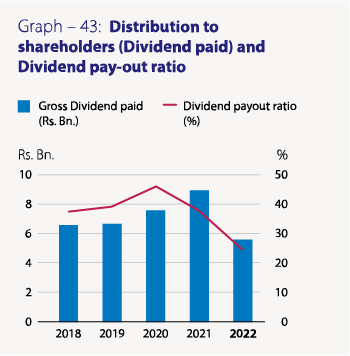
| Gross dividend paid (Rs. Bn.) | |||||
| Cash | – | 5.37 | 5.25 | 4.62 | 4.55 |
| Scrip | 5.58 | 3.58 | 2.34 | 2.06 | 2.02 |
| Total | 5.58 | 8.95 | 7.59 | 6.68 | 6.57 |
| Dividend payout ratio (%) | |||||
| Cash | – | 22.77 | 32.07 | 27.16 | 25.92 |
| Cash and shares | 24.29 | 37.94 | 46.33 | 39.23 | 37.44 |
4. Shareholders
The Bank had 17,022 ordinary voting shareholders and 5,989 ordinary non-voting shareholders as at December 31, 2022, compared to 16,609 and 5,954 voting and non-voting shareholders as at December 31, 2021 (Table 37). With one new investor joining ranks, the percentage of ordinary voting shares held by the 20 largest shareholders as at end 2022 increased to 77.38% from 71.02% as at end 2021. Similarly, a marginal increase was witnessed in the non-voting ordinary shares held by the 20 largest shareholders from 35.87% as at end 2021 to 37.85% as at end 2022.
4.1 Number of ordinary shareholders Table – 37
| As at December 31, | 2022 | 2021 |
| Ordinary shareholders – Voting | 17,022 | 16,609 |
| Ordinary shareholders – Non-voting | 5,989 | 5,954 |
| Total | 23,011 | 22,563 |
4.2 The names, number of shares and percentages of shares held by the twenty largest shareholders [As per Rule No. 7.6 (iii) of the Listing Rules of the CSE]
Voting shareholders Table – 38
| As at December 31, | 2022 | 2021(*) | |||
| Ordinary shares – Voting | Number of shares |
Percentage % |
Number of shares |
Percentage % |
|
| 1. | DFCC Bank PLC A/C 1 | 141,453,570 | 12.12 | 136,272,121 | 12.12 |
| 2. | Mr Y S H I Silva | 115,528,595 | 9.90 | 111,100,779 | 9.88 |
| 3. | Employees Provident Fund | 100,567,740 | 8.62 | 96,883,940 | 8.62 |
| 4. | Mr D P Pieris | 90,005,231 | 7.71 | 26,696,174 | 2.37 |
| 5. | CB NY S/A International Finance Corporation | 83,033,546 | 7.11 | 79,992,025 | 7.11 |
| 6. | Sri Lanka Insurance Corporation Ltd. – Life Fund | 58,905,563 | 5.05 | 56,747,851 | 5.05 |
| 7. | Melstacorp PLC | 48,290,086 | 4.14 | 46,521,219 | 4.14 |
| 8. | Mr K D D Perera | 42,894,365 | 3.67 | 35,623,143 | 3.17 |
| 9. | CB NY S/A IFC Emerging Asia Fund LP | 42,806,493 | 3.67 | 41,238,490 | 3.67 |
| 10. | CB NY S/A IFC Financial Institutions Growth Fund LP | 42,806,493 | 3.67 | 41,238,490 | 3.67 |
| 11. | Sri Lanka Insurance Corporation Ltd. – General Fund | 41,306,794 | 3.54 | 39,793,725 | 3.54 |
| 12. | Employees Trust Fund Board | 20,330,734 | 1.74 | 19,586,019 | 1.74 |
| 13. | Renuka Hotels PLC | 15,053,876 | 1.29 | 11,118,680 | 0.99 |
| 14. | Cargo Boat Development Company PLC | 10,565,178 | 0.91 | 8,017,215 | 0.71 |
| 15. | Mr M J Fernando | 10,492,476 | 0.90 | 10,108,137 | 0.90 |
| 16. | Hallsville Trading Group INC. | 10,271,852 | 0.88 | 7,876,387 | 0.70 |
| 17. | Renuka Consultants & Services Limited | 9,275,689 | 0.79 | 8,935,921 | 0.79 |
| 18. | Mr A H Munasinghe | 7,660,822 | 0.66 | 4,882,125 | 0.43 |
| 19. | Mr S V Somasunderam | 6,391,472 | 0.55 | 6,001,380 | 0.53 |
| 20. | Seylan Bank PLC/Andaradeniya Estate (Pvt) Ltd. | 5,555,536 | 0.48 | 10,000,000 | 0.89 |
| Subtotal | 903,196,111 | 77.38 | 798,633,821 | 71.02 | |
| Other shareholders | 264,040,331 | 22.62 | 325,846,707 | 28.98 | |
| Total | 1,167,236,442 | 100.00 | 1,124,480,528 | 100.00 | |
(*) Comparative shareholdings as at December 31, 2021 of the twenty largest shareholders as at December 31, 2022.
Non-voting shareholders Table – 39
| As at December 31, | 2022 | 2021(*) | |||
| Ordinary shares – Non-voting | Number of shares |
Percentage % |
Number of shares |
Percentage % |
|
| 1. | Employees Trust Fund Board | 5,643,261 | 7.78 | 5,425,375 | 7.78 |
| 2. | Akbar Brothers (Pvt) Ltd. A/C No. 1 | 3,542,491 | 4.88 | 3,345,296 | 4.80 |
| 3. | GF Capital Global Limited | 1,875,479 | 2.59 | 1,803,067 | 2.59 |
| 4. | Mr A H Munasinghe | 1,762,178 | 2.43 | 1,694,141 | 2.43 |
| 5. | Mr M F Hashim | 1,304,361 | 1.80 | 1,362,616 | 1.95 |
| 6. | M J F Exports (Pvt) Ltd. | 1,240,950 | 1.71 | 1,193,037 | 1.71 |
| 7. | Mrs L V C Samarasinha | 1,144,500 | 1.58 | 1,052,622 | 1.51 |
| 8. | Janashakthi Insurance PLC - Shareholders | 1,076,533 | 1.48 | 1,098,757 | 1.58 |
| 9. | Saboor Chatoor (Pvt) Ltd. | 1,037,989 | 1.43 | 997,913 | 1.43 |
| 10. | Mr T W A Wickramasinghe, Mrs N Wickramasinghe (Joint) | 985,150 | 1.36 | 859,923 | 1.23 |
| 11. | Deutsche Bank AG as Trustee to Assetline Income Plus Growth Fund | 935,463 | 1.29 | 899,345 | 1.29 |
| 12. | Mr E Chatoor | 859,134 | 1.18 | 825,963 | 1.18 |
| 13. | Bansei Securities Capital (Pvt) Ltd./I.S.P. Perera | 836,000 | 1.15 | – | – |
| 14. | Mr R Gautam | 786,344 | 1.08 | 745,897 | 1.07 |
| 15. | Mr J D Bandaranayake, Ms N Bandaranayake and Dr V Bandaranayake (Joint) | 772,196 | 1.06 | 742,382 | 1.06 |
| 16. | Mr K S M De Silva | 758,418 | 1.05 | 706,366 | 1.01 |
| 17. | Mr J D Bandaranayake, Dr V Bandaranayake and Ms I Bandaranayake (Joint) | 749,713 | 1.03 | 720,767 | 1.03 |
| 18. | Mr A L Gooneratne | 747,743 | 1.03 | 718,873 | 1.03 |
| 19. | Mr M J Fernando | 712,766 | 0.98 | 685,247 | 0.98 |
| 20. | Mr P G N D Gunathilake | 700,000 | 0.96 | 144,758 | 0.21 |
| Subtotal | 27,470,669 | 37.85 | 25,022,345 | 35.87 | |
| Other shareholders | 45,070,936 | 62.15 | 44,718,426 | 64.13 | |
| Total | 72,541,605 | 100.00 | 69,740,771 | 100.00 | |
(*) Comparative shareholdings as at December 31, 2021 of the twenty largest shareholders as at December 31, 2022.
4.3 Public shareholding [As per Rule No. 7.6 (iv) and Rule No. 7.13.1 of the Listing Rules of the CSE] Table – 40
| 2022 | 2021 | |||
| Number | Percentage % |
Number | Percentage % |
|
| Number of shareholders representing the public holding (Voting) | 16,989 | 99.81 | 16,569 | 99.77 |
| Number of shareholders representing the public holding (Non-voting) | 5,985 | 99.88 | 5,949 | 99.86 |
| Float adjusted market capitalisation Rs. Bn. – (Compliant under Option 1) | 61 | 94 | ||
4.4 Directors’ shareholding including the Chief Executive Officer’s shareholding [As per Rule No. 7.6 (v) of the Listing Rules of the CSE] Table – 41
| Ordinary shares – Voting | Ordinary shares – Non-voting | |||
| 2022 | 2021 | 2022 | 2021 | |
| Prof A K W Jayawardane – Chairman | 13,580 | 13,083 | Nil | Nil |
| Mr Sharhan Muhseen – Deputy Chairman | 2,598 | 2,503 | Nil | Nil |
| Mr S C U Manatunge – Managing Director/Chief Executive Officer | 75,815 | 73,038 | Nil | Nil |
| Mr K Dharmasiri | Nil | Nil | Nil | Nil |
| Mr S Prabagar (*) | 165,703 | 150,000 | 24,578 | 23,630 |
| Mr L D Niyangoda | Nil | Nil | Nil | Nil |
| Ms N T M S Cooray | 363,592 | 350,274 | 56,429 | 54,251 |
| Ms J Lee | Nil | Nil | Nil | Nil |
| Mr R Senanayake | Nil | Nil | Nil | Nil |
| Mrs D L T S Wijewardena | Nil | Nil | Nil | Nil |
| Dr Sivakumar Selliah (**) | 27,161 | 261,167 | Nil | Nil |
(*) Appointed as a Director w.e.f. May 12, 2022
(**) Appointed as a Director w.e.f. April 27, 2022
4.5 Distribution schedule of number of holders and percentage of holding in each class of equity securities
[As per Rule No. 7.6 (x) of the Listing Rules of the CSE] Table – 42
| As at December 31, 2022 | As at December 31, 2021 | |||||||
| Number of shareholders |
Percentage % |
Number of shares |
Percentage % |
Number of shareholders |
Percentage % |
Number of shares |
Percentage % |
|
| Ordinary shares – Voting | ||||||||
| 1 – 1,000 | 9,449 | 55.51 | 2,195,132 | 0.19 | 9,159 | 55.14 | 2,197,203 | 0.20 |
| 1,001 – 10,000 | 5,164 | 30.34 | 17,649,929 | 1.51 | 5,004 | 30.13 | 17,389,250 | 1.55 |
| 10,001 – 100,000 | 2,024 | 11.89 | 56,831,179 | 4.87 | 2,032 | 12.23 | 57,783,364 | 5.14 |
| 100,001 – 1,000,000 | 322 | 1.89 | 83,764,568 | 7.18 | 340 | 2.05 | 89,545,274 | 7.96 |
| Over 1,000,000 | 63 | 0.37 | 1,006,795,634 | 86.25 | 74 | 0.45 | 957,565,437 | 85.15 |
| Total | 17,022 | 100.00 | 1,167,236,442 | 100.00 | 16,609 | 100.00 | 1,124,480,528 | 100.00 |
| Ordinary shares – Non-voting | ||||||||
| 1 – 1,000 | 3,272 | 54.63 | 774,139 | 1.07 | 3,306 | 55.53 | 810,801 | 1.16 |
| 1,001 – 10,000 | 1,936 | 32.33 | 6,551,991 | 9.03 | 1,885 | 31.66 | 6,514,550 | 9.34 |
| 10,001 – 100,000 | 669 | 11.17 | 18,351,415 | 25.30 | 653 | 10.97 | 17,992,665 | 25.80 |
| 100,001 – 1,000,000 | 103 | 1.72 | 28,236,318 | 38.92 | 102 | 1.71 | 27,447,844 | 39.36 |
| Over 1,000,000 | 9 | 0.15 | 18,627,742 | 25.68 | 8 | 0.13 | 16,974,911 | 24.34 |
| Total | 5,989 | 100.00 | 72,541,605 | 100.00 | 5,954 | 100.00 | 69,740,771 | 100.00 |
4.6 Composition of shareholders based on residency and category Table – 43
| As at December 31, 2022 | As at December 31, 2021 | |||||||
| Number of shareholders |
Percentage % |
No. of shares |
Percentage % |
Number of shareholders |
Percentage % |
No. of shares |
Percentage % |
|
| Ordinary shares – Voting | ||||||||
| Resident | 16,774 | 98.54 | 965,754,985 | 82.74 | 16,353 | 98.46 | 892,930,537 | 79.41 |
| Non-resident | 248 | 1.46 | 201,481,457 | 17.26 | 256 | 1.54 | 231,549,991 | 20.59 |
| Total | 17,022 | 100.00 | 1,167,236,442 | 100.00 | 16,609 | 100.00 | 1,124,480,528 | 100.00 |
| Individuals | 16,369 | 96.16 | 427,935,318 | 36.66 | 15,895 | 95.70 | 350,776,984 | 31.19 |
| Institutions | 653 | 3.84 | 739,301,124 | 63.34 | 714 | 4.30 | 773,703,544 | 68.81 |
| Total | 17,022 | 100.00 | 1,167,236,442 | 100.00 | 16,609 | 100.00 | 1,124,480,528 | 100.00 |
| Ordinary shares – Non-voting | ||||||||
| Resident | 5,915 | 98.76 | 68,026,397 | 93.78 | 5,883 | 98.81 | 65,580,173 | 94.03 |
| Non-resident | 74 | 1.24 | 4,515,208 | 6.22 | 71 | 1.19 | 4,160,598 | 5.97 |
| Total | 5,989 | 100.00 | 72,541,605 | 100.00 | 5,954 | 100.00 | 69,740,771 | 100.00 |
| Individuals | 5,752 | 96.04 | 47,993,209 | 66.16 | 5,699 | 95.72 | 46,434,683 | 66.58 |
| Institutions | 237 | 3.96 | 24,548,396 | 33.84 | 255 | 4.28 | 23,306,088 | 33.42 |
| Total | 5,989 | 100.00 | 72,541,605 | 100.00 | 5,954 | 100.00 | 69,740,771 | 100.00 |
5. Material foreseeable risk factors [As per Rule No. 7.6 (vi) of the Listing Rules of the CSE]
Information pertaining to the material foreseeable risk factors, that require disclosures as per the Rule No. 7.6 (vi) of the Listing Rules of the CSE is discussed in the section on “Risk Governance and Management”.
6. Material issues pertaining to employees and industrial relations pertaining to the Bank [As per Rule No. 7.6 (vii) of the Listing Rules of the CSE]
During the year under review, there were no material issues relating to employees and industrial relations pertaining to the Bank, which warrant disclosure.
7. Information on movement in number of shares represented by the stated capital [As per Rule No.7.6 (ix) of the Listing Rules of the CSE] Table – 44
| Number of shares | |||||||
| Year | Description | Type of share | Basis | Number of shares issued/ (redeemed) |
Ordinary shares voting |
Ordinary shares non-voting |
Cumulative redeemable preference shares |
| 1987 | As at December 31, 1987 | 3,000,000 | – | – | |||
| 1988 | Bonus issue | Voting | 2 for 3 | 2,000,000 | 5,000,000 | – | – |
| 1990 | Bonus issue | Voting | 1 for 1 | 5,000,000 | 10,000,000 | – | – |
| 1993 | Rights issue | Voting | 1 for 4 | 2,500,000 | 12,500,000 | – | – |
| 1996 | Bonus issue | Voting | 3 for 5 | 7,500,000 | 20,000,000 | – | – |
| Rights issue | Voting | 1 for 4 | 5,000,000 | 25,000,000 | – | – | |
| Share swap | Non-voting | 894,275 | 25,000,000 | 894,275 | – | ||
| Bonus issue | Non-voting | 3 for 5 | 536,565 | 25,000,000 | 1,430,840 | – | |
| Rights issue | Non-voting | 1 for 4 | 357,710 | 25,000,000 | 1,788,550 | – | |
| 1998 | Bonus issue | Voting | 3 for 10 | 7,500,000 | 32,500,000 | 1,788,550 | – |
| Bonus issue | Non-voting | 3 for 10 | 536,565 | 32,500,000 | 2,325,115 | – | |
| 2001 | Bonus issue | Voting | 1 for 5 | 6,500,000 | 39,000,000 | 2,325,115 | – |
| Bonus issue | Non-voting | 1 for 5 | 465,023 | 39,000,000 | 2,790,138 | – | |
| Issue of cumulative redeemable preference shares |
90,655,500 | 39,000,000 | 2,790,138 | 90,655,500 | |||
| 2003 | Bonus issue | Voting | 1 for 3 | 13,000,000 | 52,000,000 | 2,790,138 | 90,655,500 |
| Rights issue | Voting | 1 for 4 | 13,000,000 | 65,000,000 | 2,790,138 | 90,655,500 | |
| Bonus issue | Non-voting | 1 for 3 | 930,046 | 65,000,000 | 3,720,184 | 90,655,500 | |
| Rights issue | Non voting | 1 for 4 | 930,046 | 65,000,000 | 4,650,230 | 90,655,500 | |
| Issue of cumulative redeemable preference shares |
100,000,000 | 65,000,000 | 4,650,230 | 190,655,500 | |||
| 2004 | ESOP | Voting | 29,769 | 65,029,769 | 4,650,230 | 190,655,500 | |
| 2005 | ESOP | Voting | 1,361,591 | 66,391,360 | 4,650,230 | 190,655,500 | |
| Bonus issue | Voting | 1 for 1 | 66,389,162 | 132,780,522 | 4,650,230 | 190,655,500 | |
| Bonus issue | Non-voting | 1 for 1 | 4,650,230 | 132,780,522 | 9,300,460 | 190,655,500 | |
| 2006 | ESOP | Voting | 737,742 | 133,518,264 | 9,300,460 | 190,655,500 | |
| Redemption of cumulative redeemable preference shares | (90,655,500) | 133,518,264 | 9,300,460 | 100,000,000 | |||
| 2007 | Rights issue | Voting | 3 for 10 | 40,288,996 | 173,807,260 | 9,300,460 | 100,000,000 |
| Bonus issue | Voting | 1 for 3 | 58,204,268 | 232,011,528 | 9,300,460 | 100,000,000 | |
| ESOP | Voting | 919,649 | 232,931,177 | 9,300,460 | 100,000,000 | ||
| Rights issue | Non-voting | 3 for 10 | 2,790,138 | 232,931,177 | 12,090,598 | 100,000,000 | |
| Bonus issue | Non-voting | 1 for 3 | 4,030,199 | 232,931,177 | 16,120,797 | 100,000,000 | |
| 2008 | Redemption of cumulative redeemable preference shares | (100,000,000) | 232,931,177 | 16,120,797 | – | ||
| ESOP | Voting | 350,049 | 233,281,226 | 16,120,797 | – | ||
| 2009 | ESOP | Voting | 540,045 | 233,821,271 | 16,120,797 | – | |
| 2010 | Share split | Voting | 1 for 2 | 117,402,608 | 351,223,879 | 16,120,797 | – |
| Share split | Non-voting | 1 for 2 | 8,060,398 | 351,223,879 | 24,181,195 | – | |
| ESOP | Voting | 2,081,508 | 353,305,387 | 24,181,195 | – | ||
| 2011 | Scrip issue for final dividend 2010 | Voting | Rs. 2.00 per share | 2,277,195 | 355,582,582 | 24,181,195 | – |
| Scrip issue for final dividend 2010 | Non-voting | 255,734 | 355,582,582 | 24,436,929 | – | ||
| ESOP | Voting | 1,457,645 | 357,040,227 | 24,436,929 | – | ||
| Rights issue | Voting | 1 for 14 | 25,502,433 | 382,542,660 | 24,436,929 | – | |
| Rights issue | Non-voting | 1 for 14 | 1,745,494 | 382,542,660 | 26,182,423 | – | |
| Share split | Voting | 1 for 1 | 382,542,660 | 765,085,320 | 26,182,423 | – | |
| Share split | Non-voting | 1 for 1 | 26,182,423 | 765,085,320 | 52,364,846 | – | |
| 2012 | Scrip issue for final dividend 2011 | Voting | Rs. 2.00 per share | 13,587,144 | 778,672,464 | 52,364,846 | – |
| Scrip issue for final dividend 2011 | Non-voting | 1,108,902 | 778,672,464 | 53,473,748 | – | ||
| ESOP | Voting | 1,341,768 | 780,014,232 | 53,473,748 | – | ||
| 2013 | Scrip issue for final dividend 2012 | Voting | Rs. 2.00 per share | 13,076,189 | 793,090,421 | 53,473,748 | – |
| Scrip issue for final dividend 2012 | Non-voting | 1,069,474 | 793,090,421 | 54,543,222 | – | ||
| ESOP | Voting | 1,445,398 | 794,535,819 | 54,543,222 | – | ||
| 2014 | Scrip issue for final dividend 2013 | Voting | Rs. 2.00 per share | 12,504,344 | 807,040,163 | 54,543,222 | – |
| Scrip issue for final dividend 2013 | Non-voting | 1,036,724 | 807,040,163 | 55,579,946 | – | ||
| ESOP | Voting | 3,237,566 | 810,277,729 | 55,579,946 | – | ||
| 2015 | Scrip issue for final dividend 2014 | Voting | Rs. 2.00 per share | 8,118,773 | 818,396,502 | 55,579,946 | – |
| Scrip issue for final dividend 2014 | Non-voting | 719,740 | 818,396,502 | 56,299,686 | – | ||
| ESOP | Voting | 2,170,613 | 820,567,115 | 56,299,686 | – | ||
| 2016 | Scrip issue for final dividend 2015 | Voting | Rs. 2.00 per share | 11,818,040 | 832,385,155 | 56,299,686 | – |
| Scrip issue for final dividend 2015 | Non-voting | 912,967 | 832,385,155 | 57,212,653 | – | ||
| ESOP | Voting | 1,136,732 | 833,521,887 | 57,212,653 | – | ||
| 2017 | Scrip issue for final dividend 2016 | Voting | Rs. 2.00 per share | 10,521,802 | 844,043,689 | 57,212,653 | – |
| Scrip issue for final dividend 2016 | Non-voting | 903,357 | 844,043,689 | 58,116,010 | – | ||
| Rights issue | Voting | 1 for 10 | 84,649,465 | 928,693,154 | 58,116,010 | – | |
| Rights issue | Non-voting | 1 for 10 | 5,811,601 | 928,693,154 | 63,927,611 | – | |
| ESOP | Voting | 3,278,537 | 931,971,691 | 63,927,611 | – | ||
| 2018 | Scrip issue for final dividend 2017 | Voting | Rs. 2.00 per share | 11,998,388 | 943,970,079 | 63,927,611 | – |
| Scrip issue for final dividend 2017 | Non-voting | 1,085,563 | 943,970,079 | 65,013,174 | – | ||
| ESOP | Voting | 1,739,324 | 945,709,403 | 65,013,174 | – | ||
| 2019 | Scrip issue for final dividend 2018 | Voting | Rs. 2.00 per share | 15,249,529 | 960,958,932 | 65,013,174 | – |
| Scrip issue for final dividend 2018 | Non-voting | 1,241,095 | 960,958,932 | 66,254,269 | – | ||
| ESOP | Voting | 293,385 | 961,252,317 | 66,254,269 | – | ||
| 2020 | Scrip issue for final dividend 2019 | Voting | Rs. 2.00 per share | 22,485,434 | 983,737,751 | 66,254,269 | – |
| Scrip issue for final dividend 2019 | Non-Voting | 1,716,432 | 983,737,751 | 67,970,701 | – | ||
| Issue of shares via a Private Placement | Voting | 115,197,186 | 1,098,934,937 | 67,970,701 | – | ||
| 2021 | Scrip issue for final dividend 2020 | Voting | Rs. 2.00 per share | 25,071,337 | 1,124,006,274 | 67,970,701 | – |
| Scrip issue for final dividend 2020 | Non-Voting | 1,770,070 | 1,124,006,274 | 69,740,771 | – | ||
| ESOP | Voting | 474,254 | 1,124,480,528 | 69,740,771 | – | ||
| 2022 | Scrip issue for final dividend 2021 | Voting | Rs. 3.00 per share | 42,755,914 | 1,167,236,442 | 69,740,771 | - |
| Scrip issue for final dividend 2021 | Non-Voting | 2,800,834 | 1,167,236,442 | 72,541,605 | - | ||
8. Engaging with shareholders
During the year, the Bank complied with its Shareholder Communication Policy, which outlines the various formal channels through which it engages with shareholders. It covers the timely communication of quarterly performance of the Group and the Bank as set out in “Summary of Interim Financial Statements – Group and Bank”. It also records significant events that may reasonably be expected to impact the share price. (More details are given in Financial Calendar)
9. Quarterly performance in 2022 compared to 2021 [As per Rule No. 7.4 (a) (i) of the Listing Rules of the CSE]
Despite the challenges faced during the year, the Bank duly submitted the Interim Financial Statements for the year 2022 to the CSE within applicable statutory deadlines. (The Bank duly complied with this requirement for 2021 as well). Please refer “Financial Calendar” for further details. A Summary of the Income Statement and the Statement of Financial Position depicting quarterly performance during 2022 together with comparatives for 2021 is given in “Summary of Interim Financial Statements – Group and Bank” for the information of stakeholders.
The Audited Income Statement for the year ended December 31, 2022 and the Audited Statement of Financial Position as at December 31, 2022 will be submitted to the CSE within three months from the year end, which is well within the required deadline as required by Rule No. 7.5 (a) of the Listing Rules of the CSE. (The Bank duly complied with this requirement for 2021).
This Annual Report in its entirety is available on the Bank’s website both as a PDF file and as well as an interactive version (https://www.combank.lk/investors).
Shareholders may also elect to receive a hard copy of the Annual Report on request. The Company Secretary of the Bank will respond to individual letters received from shareholders based on the requests made through the specimen request letter included in the booklet sent to shareholders.
10. Debt securities
Details of debentures issued and redeemed by the Bank during the year as well as the balances outstanding is as shown in the Table 45 given below:
10.1 Debenture composition Table – 45
| Fixed Interest Rate | Fixed Interest Rate | ||||||||||||||
| 2022 | 2021 | ||||||||||||||
| Type of Issue | Public | Public | Public | Public | Public | Public | Public | Public | Public | Public | Public | Public | Public | Public | Public |
| Debenture Type | Type "B" | Type "B" | Type "A" | Type "B" | Type "A" | Type "B" | Type "A" | Type "B" | Type "C" | Type "B" | Type "B" | Type "A" | Type "B" | Type "A" | Type "B" |
| CSE Listing | Listed | Listed | Listed | Listed | Listed | Listed | Listed | Listed | Listed | Listed | Listed | Listed | Listed | Listed | Listed |
| Issue Date | 9-Mar-16 | 28-Oct-16 | 23-Jul-18 | 23-Jul-18 | 21-Sep-21 | 21-Sep-21 | 12-Dec-22 | 12-Dec-22 | 12-Dec-22 | 9-Mar-16 | 28-Oct-16 | 23-Jul-18 | 23-Jul-18 | 21-Sep-21 | 21-Sep-21 |
| Maturity Date | 8-Mar-26 | 27-Oct-26 | 22-Jul-23 | 22-Jul-28 | 20-Sep-26 | 20-Sep-28 | 11-Dec-27 | 11-Dec-29 | 11-Dec-32 | 8-Mar-26 | 27-Oct-26 | 22-Jul-23 | 22-Jul-28 | 20-Sep-26 | 20-Sep-28 |
| Interest Payable Frequency | Bi-annually | Bi-annually | Bi-annually | Bi-annually | Bi-annually | Bi-annually | Bi-annually | Bi-annually | Bi-annually | Bi-annually | Bi-annually | Bi-annually | Bi-annually | Bi-annually | Bi-annually |
| Offered Interest Rate | 11.25% p.a. | 12.25% p.a. | 12.00% p.a. | 12.50% p.a. | 9.00% p.a. | 9.50% p.a. | 28.00% p.a. | 27.00% p.a. | 22.00% p.a. | 11.25% p.a. | 12.25% p.a. | 12.00% p.a. | 12.50% p.a. | 9.00% p.a. | 9.50% p.a. |
| Amount (Rs. Mn.) | 1,749.09 | 1,928.20 | 8,393.84 | 1,606.16 | 4,237.47 | 4,358.00 | 6,724.68 | 3,263.82 | 11.50 | 1,749.09 | 1,928.20 | 8,393.84 | 1,606.16 | 4,237.47 | 4,358.00 |
| Market Values | |||||||||||||||
| – Highest (Rs.) | Not traded during the year | Not traded during the year | Not traded during the year | Not traded during the year | Not traded during the year | 102.00 | Not traded during the year | Not traded during the year | Not traded during the year | Not traded during the year | Not traded during the year | Not traded during the year | Not traded during the year | Not traded during the year | 102.00 |
| – Lowest (Rs.) | 100.00 | 100.00 | |||||||||||||
| – Year-end (Rs.) | 102.00 | 102.00 | |||||||||||||
| Interest Rates | |||||||||||||||
| – Coupon Rate (%) | 11.25 | 12.25 | 12.00 | 12.50 | 9.00 | 9.50 | 28.00 | 27.00 | 22.00 | 11.25 | 12.25 | 12.00 | 12.50 | 9.00 | 9.50 |
| – Effective Annual Yield (%) |
11.57 | 12.63 | 12.36 | 12.89 | 9.20 | 9.73 | 29.96 | 28.82 | 23.21 | 11.57 | 12.63 | 12.36 | 12.89 | 9.20 | 9.73 |
| Interest rate of comparable Government Securities (%) |
30.70 | 28.20 | 32.02 | 26.30 | 28.20 | 26.30 | 26.85 | 26.85 | 26.10 | 10.67 | 10.86 | 8.45 | 11.32 | 10.65 | 11.42 |
| Other Ratios as at date of last trade | |||||||||||||||
| – Interest Yield (%) | N/A | N/A | N/A | N/A | N/A | N/A | N/A | N/A | N/A | N/A | N/A | N/A | N/A | N/A | N/A |
| – Yield to Maturity (%) | N/A | N/A | N/A | N/A | N/A | 9.50 | N/A | N/A | N/A | N/A | N/A | N/A | N/A | N/A | N/A |
11. Key shareholder return indicators Table – 46
| 2022 | 2021 | |
| Debt equity ratio (%) | 34.02 | 23.74 |
| Net assets value per share (Rs.) | 164.30 | 138.08 |
| Interest cover (Times) | 7.31 | 13.18 |
| Liquid assets ratio (%) (Minimum requirement 20%) | ||
| Domestic Banking Unit | 35.01 | 38.73 |
| Off-shore Banking Unit | 32.37 | 36.39 |
| Consolidated (Sri Lankan operations) | 35.88 | N/A |
| Liquidity Coverage Ratio – LCR (%) – Minimum requirement – (90%) | ||
| Rupee | 405.91 | 425.97 |
| All Currency | 293.91 | 242.52 |
| Net Stable Funding Ratio – NSFR (%) – Minimum requirement – (90%) | 173.58 | 157.47 |
12. Credit ratings
12.1 National long-term ratings
In April 2022, reflecting heightened near-term downside risk stemming from constrained access to foreign-currency funding and the resulting indications of stress experienced by the banks in the system, exacerbated by the sovereign’s credit profile, Fitch Ratings Lanka Ltd. (Fitch) revised the Bank’s National Long-term Rating from “AA-(lka)/stable outlook” to “AA-(lka)/Rating Watch Negative” along with 12 other banks. In January 2023, following the sovereign downgrade and recalibration of Fitch’s Sri Lanka National Rating Scale, Fitch downgraded the Bank’s National Long-term Rating from “AA-(lka)/Rating Watch Negative” to “A(lka)/Rating Watch Negative” along with nine other banks.
Meanwhile, the Bank’s Bangladesh Operation’s credit rating was reaffirmed at AAA by Credit Rating Information Services Ltd. in June 2022 for the 12th consecutive year.
The ratings reflect the Bank’s intrinsic financial strength, the established domestic franchise as Sri Lanka’s third-largest bank and the entrenched domestic deposit franchise that underpins the Bank’s funding and liquidity profile.
12.2 Credit ratings – Debentures
The credit rating of the Bank’s Subordinated Debentures was also revised to “AA-(lka)/Rating Watch Negative” to “A(lka)/Rating Watch Negative” by Fitch Ratings Lanka Ltd., in April 2022 and same was downgraded to AA-(lka)/Rating Watch in January 2023 due to the reasons mentioned in Section 12.1 above.