Operating Environment
Operating Context and Outlook
This Annual Report is meant to be read in the backdrop of the global and local developments elaborated below that contextualise the Bank’s performance.
Global economy
The global fight against inflation, Russia’s war in Ukraine, and a resurgence of COVID-19 in China weighed on global economic activity in 2022, and the first two factors are likely to continue to do so in 2023. Despite these headwinds, real GDP was surprisingly strong in the third quarter of 2022 in numerous economies, including the United States, the euro area, and major emerging market and developing economies. The sources of these surprises were in many cases domestic.
However, in the fourth quarter of 2022, this uptick is estimated to have faded in most though not all major economies. US growth remained stronger than expected, with consumers continuing to spend from their stock of savings, unemployment near historic lows, and plentiful job opportunities. But elsewhere, high-frequency activity indicators (such as business and consumer sentiment, purchasing manager surveys, and mobility indicators) generally point to a slowdown.
Economic activity in China slowed in the fourth quarter of 2022 amid multiple large COVID-19 outbreaks in Beijing and other densely populated localities.
Global slowdown in economic activities, reduced global trade and the drop in shipping charges have reduced international commodity prices.
Overall, financial stability risks remain elevated as investors reassess their inflation and monetary policy outlook. Global financial conditions have eased somewhat, driven largely by changing market expectations regarding the interest rate cycle. While the expected peak in policy rates has risen, markets now also expect the subsequent fall in rates will be significantly faster. As a result, global bond yields have recently declined, corporate spreads have tightened, and equity markets have rebounded. That said, central banks are likely to continue to tighten monetary policy to fight inflation, and concerns that this restrictive stance could tip the economy into a recession have increased in major advanced economies.
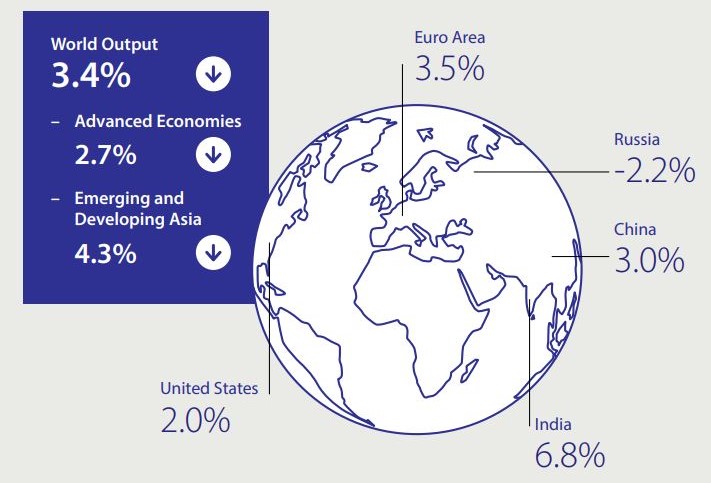
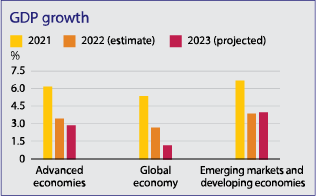
Table – 05: World economic outlook projections (% change)
| 2021 | 2022 Est. | 2023 Proj. | |
| World Output | 6.2 | 3.4 | 2.9 |
| Advanced Economies | 5.4 | 2.7 | 1.2 |
| United States | 5.9 | 2.0 | 1.4 |
| Euro Area | 5.3 | 3.5 | 0.7 |
| Emerging and Developing Asia | 7.4 | 4.3 | 5.3 |
| China | 8.4 | 3.0 | 5.2 |
| India | 8.7 | 6.8 | 6.1 |
| Russia | 4.7 | -2.2 | 0.3 |
| World Trade Volume (goods & services) (*) | 10.4 | 5.4 | 2.4 |
| Oil (**) | 65.8 | 39.8 | -16.2 |
(*) Simple average of growth rates for export and import volumes (goods and services).
(**) Simple average of prices of UK Brent, Dubai Fateh, and West Texas Intermediate crude oil. The average assumed price of oil in US dollars a barrel, based on futures markets (as of November 29, 2022), is USD 81.13 in 2023 and USD 75.36 in 2024.
Source: IMF World Economic Outlook – January 2023
Figure – 07: World economic outlook projections (% change)
Sri Lankan economy
Background
The year 2022 was marked by unprecedented challenges caused by political instability, social unrest and worst economic crisis since independence, leading to sharply deteriorated macroeconomic fundamentals which were made worse by the country’s sovereign default. The impact reverberated across all industries and most significantly the banking industry.
The country plunged into a crisis situation during the year with the loss of tourism revenue following the 2019 Easter Sunday attacks and later the COVID-19 pandemic, compounded by tax cuts and years of economic mismanagement. Sri Lanka’s access to international capital markets was lost in 2020, prompting a decline of international reserves to critically low levels while external debt repayments and a widening current account deficit led to foreign exchange (FX) shortages. Amid depleted reserves, Sri Lanka announced an external debt service suspension in April 2022 and later appointed legal and financial advisors to support debt restructuring.
Deep-rooted structural problems and economic mismanagement over several decades culminated in severe economic imbalances and the impact of these unprecedented economic tensions were felt forcefully during the year under consideration.
The crisis was deepened by a notable reduction in agricultural production caused by the initial ban on the import and use of chemical fertilisers without adequate preparation and support to farmers for the agricultural transition.
Above led to the inability of the country to pay for critical imports, such as fuel, medicine and gas. The public faced soaring inflation recording an all-time high of 73.7% (NCPI), a rapidly depreciating currency and a contraction in economic growth. This situation led to political unrest and mass protests, culminating in a change in Government in July 2022.
With the pre-emptive default of foreign debt service obligations, international sovereign credit rating agencies continued to downgrade the sovereign credit ratings of Sri Lanka during the first half of 2022.
As the Sri Lankan crisis deepened, the Government opted to seek financial assistance from the IMF by way of an Extended Fund Facility (EFF) arrangement and the authorities were able to reach a staff-level agreement in September 2022, on a 48-month EFF programme with total funding amounting to USD 2.9 Bn.
However, financing assurances to restore debt sustainability from official creditors and making a good faith effort to reach a collaborative agreement with creditors are crucial before the IMF can provide financial support.
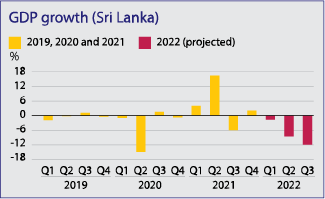
Growth: As per the GDP estimates of the World Bank, Sri Lankan economy is estimated to have contracted by 9.2% YoY in 2022, including all key sectors amid shortages of inputs and supply chain disruptions.
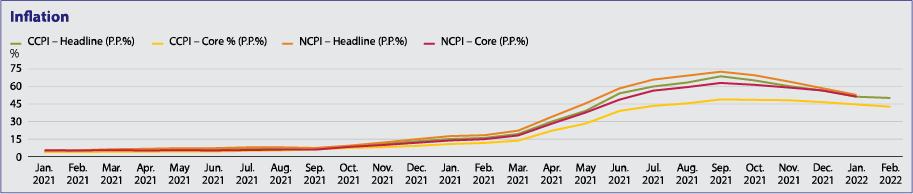
Inflation: YoY inflation reached unprecedented levels in 2022, largely due to high food inflation and drastic increase in energy prices. This also reflects the impact of rising global commodity prices, monetisation of the fiscal deficit and currency depreciation.
However, both official Consumer Price Indices (CCPI & NCPI), which moved on an accelerated pace, moderated towards the end of October 2022, and continued to decline in December 2022 for the third consecutive month, supported by subdued aggregate demand resulting from tight monetary and fiscal policies, expected improvements in domestic supply conditions along with the favourable statistical base effect. Central Bank envisages inflation to stabilise by the end of year 2023.
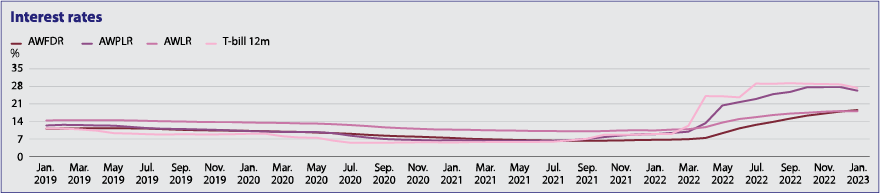
Interest Rates: The Central Bank tightened monetary policy significantly in 2022 with a view to countering rising inflationary pressures and anchoring inflation expectations. Underpinned by the significant liquidity deficit in the domestic money market and reflecting the faster pass through of tight monetary policy, market interest rates rose notably during 2022. However, market interest rates have begun to adjust downward in response to the measures adopted by the Central Bank during the latter part of 2022 and the CBSL is of the view that the maintenance of the prevailing tight monetary policy stance is imperative to ensure that monetary conditions remain sufficiently tight to rein in inflationary pressures. A gradual relaxation of the current policy, especially the interest rates, can be expected towards end of 2023.
Credit extended to the private sector by commercial banks continued to contract in response to the tight monetary conditions and the prevailing economic conditions.
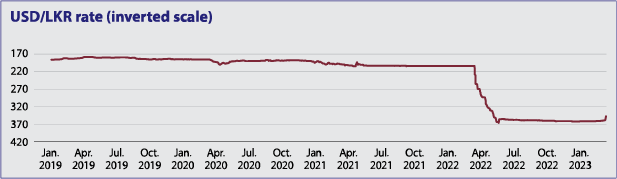
Exchange rate: CBSL allowed the Sri Lankan Rupee to float on March 08, 2022 and returned to a permissible band from mid-May 2022 after the currency depreciated from Rs. 200 to Rs. 356 since the floating. The Sri Lankan Rupee further depreciated against the US Dollar to Rs. 367 by the end of 2022.
External Trade: The merchandise trade deficit is estimated to have contracted significantly in 2022, compared to the immediately preceding years, owing to an improvement in export earnings and a substantial compression of import expenditure. Gross Official Reserves were estimated at USD 1.9 Bn. as of end 2022, including the swap facility from the People’s Bank of China (PBOC), equivalent.
Meanwhile according to the World Bank, the ongoing economic crisis is estimated to have doubled the poverty rate from 13.1% to 25.6% between 2021 and 2022, increasing the number of poor people by 2.7 million.
(Source: CBSL, World Bank & IMF)
Bangladesh economy
The Bangladesh economy has maintained a solid track record of growth and development thanks to stable macroeconomic conditions, consistent performance in readymade garment exports and robust inflows of remittances. Continuing on the rebounded growth in 2021, the economy is projected to have expanded by 7.6% in 2022 and is expected to grow by 8.5% in 2023. Rising commodity prices and a surge in imports causing a widening Balance of Payment deficit and accelerated inflation, growing fear of wider war between Russia and the West are some of the headwinds likely to affect growth projections.
Bangladesh has progressed in many areas with human development outcomes improving along many dimensions. With an HDI score of 0.655, Bangladesh moved up four notches to 129th place in the UNDP's Human Development Report in 2021, surpassing South Asian rivals India, Nepal, Pakistan, and Afghanistan. Bangladesh, which was among the poorest nations in the early 1970s, advanced to lower-middle income level in 2015 and is now on the verge of achieving middle-income status with a GDP of USD 461 Bn.
With weather being an important factor in its development objectives, Bangladesh accords priority to climate change as it is one of the most vulnerable countries to extreme weather events. Increased investments in adaptation are being made to make the country more resilient to natural disasters.
(Source: World Bank & IMF)
Banking sector
Table – 06: The Bank’s performance compared to the Banking Sector
| 2022 | 2021 | |||||
| Banking Sector (*) End September 2022 |
Commercial B ank 2022 |
Market share % Commercial Bank |
Banking Sector (*)
End 2021 |
Commercial Bank 2021 |
Market share % Commercial Bank |
|
Assets and liabilities (Rs. Tn.) |
||||||
| Gross loans and advances to other customers | 11.373 | 1.220 | 10.72 | 10.480 | 1.079 | 10.29 |
| Deposits | 14.929 | 1.914 | 12.82 | 12.671 | 1.443 | 11.39 |
| Total assets | 19.313 | 2.426 | 12.56 | 16.924 | 1.949 | 11.52 |
Profitability (%) |
||||||
| Return on Assets (ROA) – before tax | 0.96 | 1.03 | 1.62 | 1.74 | ||
| Return on Equity (ROE) | 8.45 | 12.46 | 14.52 | 14.66 | ||
| Net Interest Margin (NIM) | 4.15 | 3.74 | 3.44 | 3.51 | ||
| Cost to income ratio (excluding taxes on financial services) |
29.58 | 26.29 | 48.09 | 31.61 | ||
| CASA ratio | 33.13 | 38.36 | 36.55 | 47.83 | ||
Assets quality (%) |
||||||
| Stage 3 loans(a) to total loans and advances(b) | 10.94 | 9.41 | N/A | 7.33 | ||
| Net Stage 3 loans(c) to total loans and advances(b) | 10.82 | 5.25 | N/A | 3.85 | ||
| Stage 3 impairment coverage ratio(d) | 43.59 | 39.60 | N/A | 42.76 | ||
| Total impairment coverage ratio(e) | 7.260 | 7.32 | N/A | 5.94 | ||
| Non-performing loans to total loans and advances | N/A | N/A | 4.47 | 4.62 | ||
| Net Non-performing loans to total loans and advances | N/A | N/A | 1.66 | 1.44 | ||
| Specific provision coverage ratio | N/A | N/A | 64.02 | 68.93 | ||
Capital adequacy (%) |
||||||
| Core capital (Tier 1 capital) adequacy ratio | 12.465 | 11.389 | 13.153 | 11.923 | ||
| Total capital adequacy ratio | 15.322 | 14.657 | 16.548 | 15.650 | ||
Liquidity (%) |
||||||
| Statutory liquid assets ratio “SLAR” (DBU) | 27.83 | 35.01 | 33.77 | 38.73 | ||
| Statutory liquid assets ratio “SLAR” (OBC) | 39.58 | 32.37 | 33.99 | 36.39 | ||
| Credit to total deposits | 76.18 | 63.71 | 82.70 | 74.75 | ||
[(*) Banking Sector = Licensed Commercial Banks + Licensed Specialised Banks (Source: CBSL)]
Notes
(a) Excluding undrawn portion
(b) Total loans and advances including Stage 3 loans
(c) Net of Stage 3 impairment (including undrawn portion)
(d) The ratio of Stage 3 impairment to Stage 3 loans
(e) The ratio of total impairment to Total loans and Receivables
With these adverse macroeconomic conditions, the Banking Sector too faced many challenges which, among others, included maintaining a sustainable loan growth, non-payment of USD bond exposures by the government, fuel shortage, deteriorating asset quality requiring higher impairment charges, declining CASA ratio, drop in trade finance volumes, increasing costs driven largely by a depreciating LKR, inflation an, staff turnover led by a surge in talent migration etc.
Amidst many business difficulties, both internal and external, the capital adequacy ratios of banks came under severe stress. Additionally, Financial Year 2022 witnessed banks being weighed down by unprecedented liquidity challenges, both in LKR and FCY. Banks have had to revisit the liquidity thresholds and the related contingency plans to stay relevant in this economic scenario.
The year 2023 too is expected to be specked with many challenges, the biggest being the looming debt restructuring and its expected impact on the banks’ capital and liquidity. The economic challenges would undoubtedly cascade down to multiple industries and therefore, maintaining the portfolio quality in advances would be an uphill task which may lead to a surge in impairment provisioning.
Challenges faced by banks
Some of the main challenges faced by the banks in 2022
- Frequent disruptions to overall banking operations due to Covid-19 outbreak, power outages, fuel shortages, political & social unrest etc.
- Regulatory restrictions/Government policy changes
- Banks’ access to foreign-currency funding was constrained by the sovereign default.
- Downgrading of the country rating severely restricted banks’ accessibility to foreign currency and counterparty transactions in relation to international trade.
- Advances growth was affected by increased interest rates, regulatory restrictions on imports & capital constraints.
- Deteriorating asset quality.
- Deposits growth was affected by competitiveness in Interest rates, low disposable income of population and higher return on repo investments.
- Declining CASA ratio.
- Higher operational costs due to high inflation, rupee depreciation, changes in tax structure & unexpected expenses.
- Decline in value of the G-sec portfolio.
- New customer canvassing initiatives were at a minimal, due to the adverse economic conditions.
- Postponements of capital investment decisions due to negative economic outlook.
- Growth in deposits in the absence of lending opportunities posed challenges in managing excess liquidity.
- Foreign currency liquidity challenges faced due to black/grey market that prevailed in 2022.
Possible challenges and their impact on banks for 2023
| Challenges | Possible impact on the banks |
Economic challenges    |
|
|
|
| Regulatory challenges |
|
|
|
| Challenges faced by customers |
|
|
|
| Other |
|
|
|